
Abstract
BACKGROUND AND PURPOSE: Fluid-attenuated inversion recovery hyperintense vessels in stroke represent leptomeningeal collateral flow. We presumed that FLAIR hyperintense vessels would be more closely associated with arterial stenosis and perfusion abnormality in ischemic stroke on T2-PROPELLER-FLAIR than on T2-FLAIR.
MATERIALS AND METHODS: We retrospectively reviewed 35 patients with middle cerebral territorial infarction who underwent MR imaging. FLAIR hyperintense vessel scores were graded according to the number of segments with FLAIR hyperintense vessels in the MCA ASPECTS areas. We compared the predictability of FLAIR hyperintense vessels between T2-PROPELLER-FLAIR and T2-FLAIR for large-artery stenosis. The interagreement between perfusion abnormality and FLAIR hyperintense vessels was assessed. In subgroup analysis (9 patients with MCA horizontal segment occlusion), the association of FLAIR hyperintense vessels with ischemic lesion volume and perfusion abnormality volume was evaluated.
RESULTS: FLAIR hyperintense vessel scores were significantly higher on T2-PROPELLER-FLAIR than on T2-FLAIR (3.50 ± 2.79 versus 1.21 ± 1.47, P < .01), and the sensitivity for large-artery stenosis was significantly improved on T2-PROPELLER-FLAIR (93% versus 68%, P = .03). FLAIR hyperintense vessels on T2-PROPELLER-FLAIR were more closely associated with perfusion abnormalities than they were on T2-FLAIR (κ = 0.64 and κ = 0.27, respectively). In subgroup analysis, FLAIR hyperintense vessels were positively correlated with ischemic lesion volume on T2-FLAIR, while the mismatch of FLAIR hyperintense vessels between the 2 sequences was negatively correlated with ischemic lesion volume (P = .01).
CONCLUSIONS: In MCA stroke, FLAIR hyperintense vessels were more prominent on T2-PROPELLER-FLAIR compared with T2-FLAIR. In addition, FLAIR hyperintense vessels on T2-PROPELLER-FLAIR have a significantly higher sensitivity for predicting large-artery stenosis than they do on T2-FLAIR. Moreover, the areas showing FLAIR hyperintense vessels on T2-PROPELLER-FLAIR were more closely associated with perfusion abnormality than those on T2-FLAIR.
ABBREVIATIONS:
- FHV
- FLAIR hyperintense vessel
- GRE
- gradient-echo
- Tmax
- time-to-maximum
FLAIR hyperintense vessels (FHVs) are frequently encountered in acute ischemic stroke. Two types of FHVs, proximal and distal, have different clinical implications.1 Proximal FHVs, which are frequently observed proximal to or within the Sylvian fissure, can be used as a marker for arterial occlusion and are presumably the result of the thrombus or slow collateral flow.2⇓–4 Distal FHVs, which are present distal to the Sylvian fissure, may indicate collateral flow and salvageable brain parenchyma in acute stroke; angiography reveals that they are more related to retrograde collateral flow from arteries unaffected by occlusion.1,5 Recently, distal FHVs have been studied more due to their clinical importance.6,7
Technically, in the setting of normal hemodynamics, the blood vessels show dark signal intensity on spin-echo sequences such as FLAIR because of the dephasing effect from mixed spin-echoes and stimulated echoes, as well as the disrupted spin-echo mechanism due to through-plane blood motion. The retrograde slow flow results in the loss of this flow void phenomenon, and vessels appear hyperintense against the dark CSF background.8⇓–10
The PROPELLER technique has been implemented with conventional MR images to reduce motion-induced artifacts and increase image quality.11⇓–13 The PROPELLER technique may affect hyperintense vessels on T2-FLAIR.
We hypothesized that FHVs are assessed better on T2-PROPELLER-FLAIR than on T2-FLAIR and that FHVs are more closely associated with arterial stenosis and perfusion abnormality in ischemic stroke on T2-PROPELLER-FLAIR than on T2-FLAIR.
Materials and Methods
Patients
We retrospectively screened consecutive patients who presented to our tertiary referral medical center. We included patients with acute middle cerebral artery territory ischemic stroke within 1 week of symptom onset. They underwent advanced MR imaging. All of the patients included in the study showed restricted diffusion in the MCA territory on diffusion-weighted imaging. We excluded patients with transient ischemic attack, multiple infarctions other than in MCA territories, or lacunar infarction. Our institutional review board approved this retrospective study.
MR Imaging Protocols
Patients were imaged with a 3T MR imaging unit (Discovery MR750; GE Healthcare, Milwaukee, Wisconsin). Our advanced MR imaging protocol for acute stroke included DWI, T2-FLAIR, T2-PROPELLER-FLAIR, gradient-echo (GRE), bolus-tracking perfusion-weighted imaging, intracranial and extracranial contrast-enhanced MR angiography, and intracranial time-of-flight MRA. FLAIR images were acquired with following parameters: TR/TE = 12,000/140 ms; TI = 2500 ms; flip angle = 110°; section thickness = 4 mm; gap = 1 mm; FOV = 210 × 210 mm; matrix = 352 × 353; and 30 contiguous sections for a total acquisition of 3 minutes 20 seconds. PROPELLER-T2-FLAIR images were also acquired with commercially available 2D sequences: TR/TE = 8800/120 ms; TI = 2200 ms; flip angle = 142°; and they matched resolution with T2-FLAIR. Total acquisition time for T2-PROPELLER-FLAIR was 3 minutes 30 seconds.
Image Analysis
Two readers independently assessed either T2-FLAIR or T2-PROPELLER-FLAIR. The first review of images was randomly selected by the study coordinator; the remainder of the sequences were reviewed 1 week later. The reviewers were blinded to clinical history and imaging sequences and assessed FHVs and parenchymal ischemic lesions on both sequences.
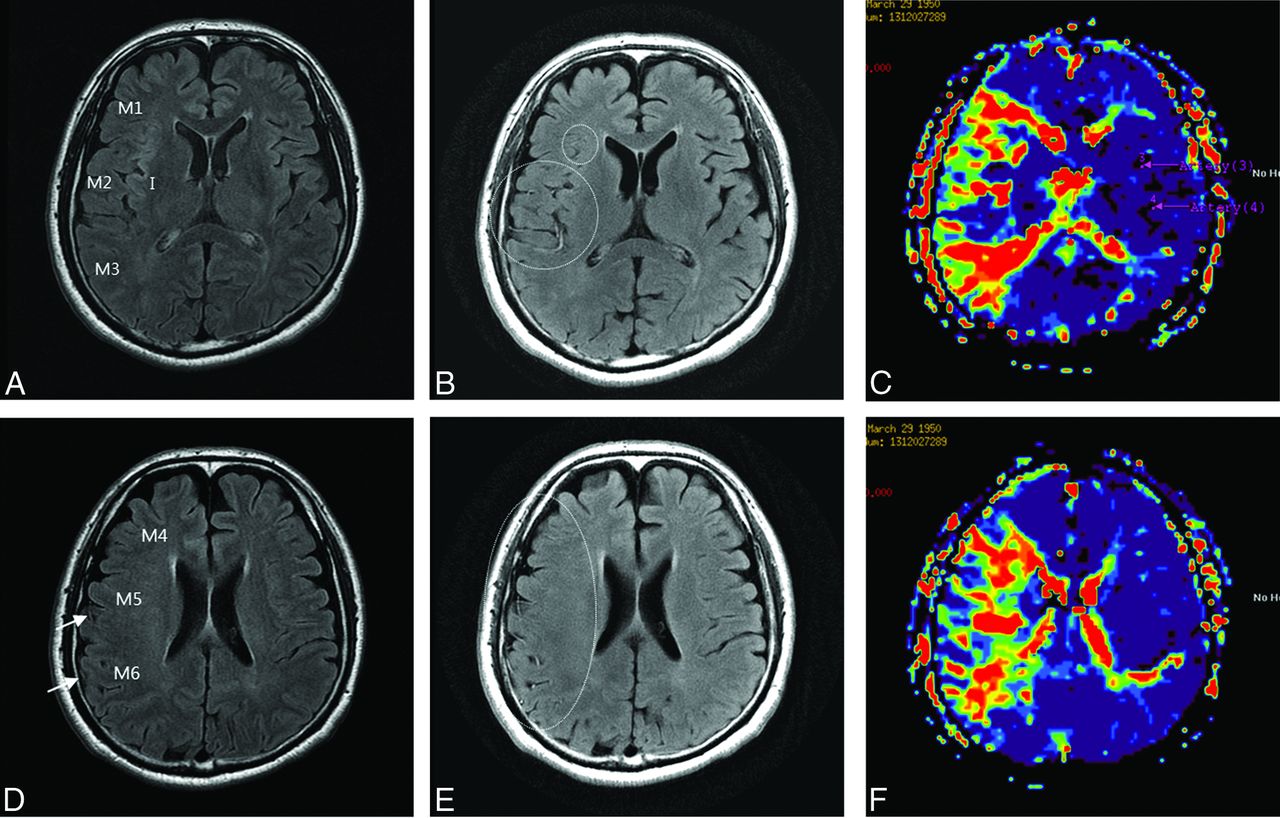
To compare FHVs on both sequences, we used FHV scores, modifying a previous method.6 In brief, images were scored from zero to 7 points by counting the number of MCA-Alberta Stroke Program Early CT Score territories in which FHVs were present.14 FHVs were counted when they appeared as linear or serpentine hyperintensities corresponding to a typical arterial course on at least 2 consecutive axial sections. The MCA ASPECTS territories are composed of 7 territories: I and M1–M3 at the level of the basal ganglia and M4–M6 at the level of the ventricles immediately above the basal ganglia. I represents the insular ribbon. M1 represents the anterior MCA cortex corresponding to the frontal operculum, M2 represents the MCA cortex lateral to the insular ribbon corresponding to the anterior temporal lobe, and M3 represents the posterior MCA cortex corresponding to the posterior temporal lobe. M4, M5, and M6 represent the anterior, lateral, and posterior MCA territories immediately superior to M1, M2, and M3, respectively.
To compare the parenchymal ischemic lesions on both sequences, we calculated the contrast-to-noise ratio between the parenchymal ischemic lesion and adjacent white matter. The contrast-to-noise ratio was defined as (SIlesion − SIWM)/SDn, where SDn is the SD of background noise. Signal intensities (SIs) of the lesion and WM were assessed by circular ROI measurements (area = 20 mm2), which were placed identically on both sequences. For qualitative assessment, 2 readers recorded parenchymal ischemic lesions while evaluating FHVs. The diagnostic sensitivity for parenchymal ischemic lesions of both sequences was calculated. The standard reference was DWI.
A third experienced reader gauged the time-to-maximum (Tmax) map of PWI with the same scoring system. A Tmax map was generated by using perfusion-processing software (FuncTool; GE Healthcare). The number of MCA-ASPECTS territories with delayed perfusion was counted instead of the FHVs. The ischemic lesion volume and perfusion abnormality volume were also measured by using DWI and the Tmax map, respectively, with the reader blinded to the FHV scores. DICOM formats of DWI and the Tmax map were imported into ImageJ software (National Institutes of Health, Bethesda, Maryland) by using a measurement stack plug-in to calculate volumes. ROIs were drawn along the borders of the high-signal area on DWI and the delayed perfusion area on the Tmax map, compared with the contralateral area of each section. The arterial stenotic lesion was determined by MRA in conjunction with DWI, Tmax, T2-FLAIR, and T2-PROPELLER-FLAIR.
Statistical Analysis
FHV scores and contrast-to-noise ratios for ischemic lesions between T2-FLAIR and T2-PROPELLER-FLAIR were compared by using a paired Student t test. The diagnostic sensitivities for parenchymal ischemic lesions were compared using the McNemar test. The interobserver agreement between the 2 readers was evaluated with κ statistics.
The sensitivity and specificity of T2-FLAIR and T2-PROPELLER-FLAIR for predicting large-artery stenosis (≥50%) and occlusion were also compared by using the McNemar test. The interagreement between both sequences and perfusion abnormality was assessed by κ statistics.
For the correlation with ischemic lesion volume and perfusion abnormality volume, subgroup analysis was performed. Due to the homogeneity of the occlusion site and the degree of stenosis, only 9 patients with horizontal segment occlusion were included. Spearman correlation analysis was used to explore the relationship among the FHV score on T2-FLAIR, FHV score on T2-PROPELLER-FLAIR, FHV mismatch, initial ischemic lesion volume, and initial perfusion abnormality volume. FHV mismatch was calculated by (FHV scores on T2-PROPELLER-FLAIR − FHV scores on T2-FLAIR) / FHV scores on T2-PROPELLER-FLAIR. Statistical analysis was performed by using commercial software (MedCalc, Version 10.1.2.0; MedCalc Software, Mariakerke, Belgium). A P value < .05 was statistically significant.
Results
Thirty-five patients fulfilled the inclusion criteria (Table 1). The mean age was 65.1 years, and 34% of patients were women. The median time from symptom onset to MR imaging was 23.4 hours (interquartile range, 9.62–57.5 hours). Large-artery stenosis (≥50%) or occlusion was seen in 28/35 patients (80%) in the following areas: the MCA horizontal segment (12/35, 34%), the MCA insular segment (5/35, 15%), the MCA cortical segment (1/35, 3%), the distal internal carotid artery (3/35, 8%), and the proximal ICA (7/35, 20%). Mild stenosis or negative findings were observed in 7/35 patients (20%).
Characteristics and MRA findings of study patientsa
The FHV score of T2-PROPELLER-FLAIR was significantly higher than that of T2-FLAIR in patients with acute MCA territory infarction (3.50 ± 2.79 versus 1.21 ± 1.47, P < .01, Table 2). The contrast-to-noise ratio between parenchymal ischemic lesions and adjacent WM on T2-PROPELLER-FLAIR was significantly lower than that on T2-FLAIR (8.43 ± 3.51 versus 20.93 ± 8.61, P < .01). However, the diagnostic sensitivity for parenchymal ischemic lesions on both sequences was not significantly different (P = 1.00). Of 153 ischemic lesions, 148 ischemic lesions (96.7%) were detected on T2- FLAIR. Meanwhile, of 153 ischemic lesions, 149 (97.4%) were detected on T2-PROPELLR-FLAIR. The interobserver agreement between the 2 readers assessing FHVs and parenchymal lesions for T2-FLAIR and T2-PROPELLER-FLAIR was excellent (κ = 0.83 and 0.87 for the FHV score, κ = 0.98 and 0.98 for parenchymal ischemic lesions).
Comparison of FHVs and parenchymal ischemic lesions between T2-FLAIR and T2-PROPELLER-FLAIRa
The FHVs were most frequently present in the Sylvian fissure on T2-FLAIR (16/35, 45%, Fig 1). FHVs were also seen in M5 (6/35, 17%), M2, M3, M4 (5/35, 14% for each), M6 (4/35, 11%), and M1 (1/35, 3%). The FHVs were most frequently present in the Sylvian fissure and M2 on the T2-PROPELLER-FLAIR (20/35, 57% for each); FHVs were seen less frequently in M3 and M6 (19/35, 54% for each), M4 (16/35, 46%), M5 (15/35, 43%), and M1 (12/35, 34%). Perfusion abnormalities were observed in M5 (20/35, 57%), M2 (19/35, 54%), M3 (19/35, 54%), M6 (18/35, 51%), M4 (13/35, 37%), the Sylvian fissure (11/35, 31%), and M1 (10/35, 28%).

The distribution of FHVs and perfusion abnormality in each MCA-ASPECTS territory. The black, gray, and dotted bars represent the frequency of FHVs and perfusion abnormality for T2-FLAIR, T2-PROPELLER-FLAIR, and Tmax, respectively.
FHVs were depicted in 19/35 patients (54%) on T2-FLAIR and in 26/35 patients (74%) on T2-PROPELLER-FLAIR. The sensitivity of T2-PROPELLER-FLAIR for predicting large-artery stenosis or occlusion was 93%, which is significantly higher than that of T2-FLAIR, 68% (P = .03). However, the specificities of both sequences were 100% (Table 3).
The predictability of FHVs for large-artery stenosis on T2-FLAIR and T2-PROPELLER-FLAIRa
Territories in which FHVs were present on T2-PROPELLER-FLAIR were more closely associated with perfusion abnormality than on T2-FLAIR (κ = 0.64 and 0.27, respectively; Fig 2, On-line Fig 1).

A 63-year-old man with right MCA territory infarction. FHVs on T2-FLAIR at the level of the basal ganglia (A) were not seen, whereas FHVs on T2-PROPELLER-FLAIR (B) were seen in the Sylvian fissure, M1, M2, and M3 (dotted circle). On the Tmax map (C), FHVs were well-matched with perfusion abnormality. FHVs on T2-FLAIR at the level of the ventricle above the basal ganglia (D) were seen in the M5 and M6 territory (arrow), whereas FHVs on T2-PROPELLER-FLAIR (E) were seen in all territories (dotted circle). On Tmax (F), FHVs on T2-PROPELLER-FLAIR were well-matched with perfusion abnormality.
In 9 patients with stroke with total occlusion of the MCA horizontal segment, FHV scores on T2-FLAIR showed a significant positive correlation with ischemic DWI lesion volume (r = 0.86, P = .01), while FHV scores on T2-FLAIR showed no significant relationship with perfusion abnormality volume (r = 0.28, P = .43). FHV scores on T2-PROPELLER-FLAIR did not show a significant relationship with ischemic lesion volume (r = 0.38, P = .34), whereas FHV scores on T2-PROPELLER-FLAIR showed a significant positive correlation with perfusion abnormality volume (r = 0.79, P = .02). FHV mismatch was significantly negatively correlated with ischemic DWI lesion volume (r = −0.79, P = .01). FHV mismatch did not show a significant relationship with perfusion abnormality volume (r = 0.33, P = .42, Table 4).
Associations among FHV scores, ischemic lesion volume, and perfusion abnormality volume in 9 patients with MCA horizontal segment occlusion
Discussion
This study found that in patients with MCA stroke, FHVs were more prominent and observed in a wider territory on T2-PROPELLER-FLAIR than on T2-FLAIR. FHVs on T2-PROPELLER-FLAIR had significantly higher sensitivity for predicting large-artery stenosis or occlusion than on T2-FLAIR. The areas showing FHVs on T2-PROPELLER-FLAIR were associated with perfusion abnormality. Moreover, increased FHV mismatch between T2-FLAIR and T2-PROPELLER-FLAIR was associated with decreased infarct volume in patients with MCA horizontal segment occlusion.
These results have clinical impact. FHVs on T2-PROPELLER-FLAIR may be used as a second-look sequence in conjunction with MRA for detecting arterial stenosis in patients with MCA stroke. FHVs on T2-FLAIR and T2-PROPELLER-FLAIR may have the potential for use in evaluating collateral status and predicting prognosis in patients with MCA stroke.
FHVs on T2-PROPELLER-FLAIR were seen in a wider territory than those on T2-FLAIR. Previous studies reported that FHVs are prominent within the Sylvian fissure.6⇓⇓⇓⇓⇓⇓⇓⇓–15 This might be because the larger arteries have a slower flow speed than the smaller distal arteries under the same perfusion pressure. Hohenhaus et al6 reported that FHVs were predominantly located in the distal central surface area (M2 and M5 region and the Sylvian fissure). However, we found fewer FHVs in the distal central surface areas (M2 and M5 regions) and other distal cortical regions (M1, M3, M4, and M6) on T2-FLAIR. On the other hand, FHVs were prominent even in distal cortical regions on T2-PROPELLER-FLAIR.
The prominence of FHVs on T2-PROPELLER-FLAIR could be explained by the following: Cerebral arteries exhibit pulsatile and anatomic positional changes.16 This motion can lead to image blurring or signal loss and could affect the small-caliber distal cerebral artery in particular due to small voxel size.17 PROPELLER corrects the motion of objects by repetitive sampling in the central k-space.18 Thus, we speculate that PROPELLER could overcome the blurring or signal loss induced by cerebral artery motion.
Many institutions use limited, short MR imaging protocols that require <20 minutes of imaging. Because the optimal stroke protocol may include only 1 sequence, either conventional T2-FLAIR or T2-PROPELLER-FLAIR, the contrast-to-noise ratio between parenchymal ischemic lesions and adjacent WM is reduced on T2-PROPELLER-FLAIR images compared with T2-FLAIR. T2-FLAIR can estimate the onset time in patients with acute ischemic stroke and may be helpful in assessing wake-up strokes.19 Although qualitative analysis showed that there was no significant difference between the 2 sequences for the detection of acute ischemic lesions, the contrast-to-noise ratio for parenchymal lesions on T2-PROPELLER-FLAIR could affect the estimation of onset time, resulting in a different treatment plan (On-line Fig 2).
Cosnard et al20 reported that FHVs correspond to MRA evidence of stenosis or occlusion. The sensitivity and specificity were 65% and 85%, respectively. Kamran et al15 reported that all 30 of their patients with FHVs had large-vessel occlusion or severe stenosis (≥90%), implying that the specificity of FHVs was 100%. Iancu-Gontard et al21 reported that the concordance between FHV and stenosis on angiography was significantly higher for the MCA territory compared with the anterior cerebral artery territory. Schellinger et al2 compared the vessel signs among CT, FLAIR, and GRE for the prediction of vessel status and found that FHVs were more sensitive than the other modalities (sensitivity for FLAIR, 65.9%; CT, 40%; GRE, 34.1%). The specificity of FHVs was 75%. On the basis of previous studies, FHVs on T2-FLAIR have high specificity but relatively low sensitivity for the prediction of large-artery stenosis; this finding is consistent with our results, which show a sensitivity of 68% and a specificity of 100%. However, we found that the sensitivity of FHVs is significantly increased (93%) when combined with the PROPELLER technique. T2-PROPELLER-FLAIR exhibited 2 false-negative cases in which collateral flows were too fast to show arterial hyperintensities. In one of the true-positive cases, arterial stenosis in the MCA cortical segment was difficult to detect, depending only on MRA. Nevertheless, occlusion of the distal arteries was detected in conjunction with FHVs on T2-PROPELLER-FLAIR (On-line Fig 3). Thus, FHVs on T2-PROPELLER-FLAIR may be used as a second-look sequence for the detection of arterial stenosis in patients with stroke. Moreover, the application of T2-PROPELLER-FLAIR might be extended to cohorts with brain tumor or neurodegenerative diseases in which MRA is not routinely performed.
Toyoda et al22 reported that in 35 of 40 patients with acute ischemic stroke, areas of intra-arterial signal distribution were equal to the regions of abnormal perfusion. However, their detailed method for analysis was not explained. Gawlitza et al23 reported that there was significant correlation between the degree of the FHV sign and PWI lesion volume, but they did not compare FHV signs with PWI territory by territory. Kwag et al24 recently reported that MR imaging with a radial k-space filling (BLADE; Siemens, Erlangen, Germany), which is a similar technique provided by other MR imaging manufacturers, also improved hyperintense vessels on T2-FLAIR. They proposed that this technique may be helpful for detecting penumbra if it is used right after DWI. However, they did not compare FHVs with perfusion abnormalities. We analyzed the relationship between FHV signs and perfusion abnormalities territory by territory. Our results indicated that territories in which FHVs were present on T2-PROPELLER-FLAIR matched perfusion abnormalities better than those of T2-FLAIR. Perfusion abnormalities included the infarct core, penumbra, and benign oligemia. Currently, there is no threshold for differentiating the spectrum of perfusion abnormalities. Because FHVs exhibited a wider territory on T2-PROPELLER-FLAIR than on T2-FLAIR and a stronger association with perfusion abnormality, we presume that FHVs are closer to wide benign oligemia territory on T2-PROPELLER-FLAIR than they are on T2-FLAIR. Further studies are needed for validation of this assumption.
In our subgroup analysis, higher FHV scores on T2-FLAIR were related to larger ischemic DWI lesion volumes. The higher the FHV mismatch was between the 2 sequences, the smaller the ischemic DWI lesion volume was. This phenomenon might be explained by the following: FHVs on both sequences lie within the spectrum of poor and good collaterals. Because FHVs on T2-FLAIR reflect relatively slow collateral flows, they may represent “poor” collaterals,25,26 while FHVs on T2-PROPELLER-FLAIR reflect relatively fast and slow collaterals, implying a mixture of “poor” and “good” collaterals. Thus, the mismatch in FHV scores between the 2 sequences may represent the “good” collaterals. However, our results should be cautiously interpreted. Previously, Lee et al1 demonstrated the existence of FHVs on T2-FLAIR with smaller ischemic lesion volume, which was interpreted as “good” collaterals compared with the absence of FHVs. Therefore, it is difficult to simply define FHVs on T2-FLAIR as “poor” collaterals. In addition, as mentioned above, T2-PROPELLER-FLAIR may miss extremely fast and good collaterals, which can result in false-negative arterial stenosis results. Future studies with a larger and homogeneous population of patients with stroke are needed to investigate this issue. Moreover, considering that FHVs are free from the technical difficulties of PWI, such as arterial input function measurement and complicated deconvolution methods,27 FHVs may be of value in ongoing research on leptomeningeal collateralization in stroke.
There were some limitations in this study. First, the number of cases was small and might not be sufficient to determine the exact diagnostic value for T2-PROPELLER-FLAIR. However, the diagnostic value of T2-FLAIR was consistent with that in previous studies and was thus presumed to be credible. Second, our cohort was heterogeneous, with patients representing both the acute and subacute stages of MCA stroke. The median time from onset to imaging was 23 hours, beyond the time window for IV or intra-arterial therapy. Thus, our results should be carefully applied in clinical practice. However, our results may serve as a cornerstone for future studies with a larger and more homogeneous population to validate and extend these results.
Conclusions
Our study showed that in patients with MCA stroke, FHVs were more prominent and observed across a wider territory on T2-PROPELLER-FLAIR than on T2-FLAIR. In addition, FHVs on T2-PROPELLER-FLAIR have a significantly higher sensitivity for predicting large-artery stenosis or occlusion than on T2-FLAIR. Moreover, the areas showing FHVs on T2-PROPELLER-FLAIR were more closely associated with perfusion abnormality than those on T2-FLAIR, reflecting leptomeningeal collateral circulation.
Footnotes
Disclosures: Sangwoo Lee—UNRELATED: Employment: GE Healthcare.
REFERENCES
- Received January 23, 2015.
- Accepted after revision April 19, 2015.
- © 2015 by American Journal of Neuroradiology


