
Abstract
BACKGROUND AND PURPOSE: Otosclerosis is commonly identified on CT as a focus of hypodensity in the otic capsule anterior to the oval window. However, otosclerosis can have a sclerotic phase approximating the density of normal bone, making diagnosis challenging. This study assesses differences in otic capsule contour and thickness anterolateral to the anterior margin of the oval window in patients with otosclerosis compared with individuals with normal hearing.
MATERIALS AND METHODS: Axial CT of 104 ears with clinically diagnosed otosclerosis and 108 consecutive ears of audiometrically normal individuals were retrospectively reviewed. Two radiologists independently evaluated the pattern of otosclerosis, otic capsule contour, and bone thickness on standardized axial images at the level of the oval window and cochleariform process. Measurements were made from the posterolateral margin of the cochlea to the apex of the otic capsule convex contour just anterolateral to the anterior margin of the oval window. In the absence of a convex contour, the sulcus between the oval window and the cochleariform process was identified, and measurement to the depth of the sulcus was used. Receiver operating characteristic analysis determined the best cutoff value of otic capsule thickness.
RESULTS: Mean otic capsule thickness (2 SDs) was 3.08 (0.93) mm and 1.82 (0.31) mm in patients with otosclerosis and individuals with normal hearing, respectively (P < .001), with excellent interobserver agreement. Otic capsule thickness of >2.3 mm had 96.2% sensitivity, 100% specificity, 100% positive predictive value, and 96.4% negative predictive value for otosclerosis. A bulging/convex contour of the otic capsule had 68.3% sensitivity, 98.1% specificity, 97.3% positive predictive value, and 76.3% negative predictive value.
CONCLUSIONS: Patients with otosclerosis have significantly thicker bone abutting the oval window than individuals with normal hearing.
ABBREVIATIONS:
- CBCT
- conebeam CT
- MDCT
- multidetector row CT
Otosclerosis is a primary osteodystrophy of the otic capsule, and a cause of progressive conductive hearing loss in adults. Severe cases of otosclerosis can result in a combination of sensorineural and conductive hearing loss.1 Otosclerosis can be categorized on the basis of the extent of involvement into fenestral and retrofenestral types, and on the phase of disease, into spongiotic (active) or sclerotic (inactive).1 The otic capsule just anterior to the oval window is the typical site of manifestation. Disease limited to this area is referred to as fenestral otosclerosis and is most commonly lucent on CT due to resorption of the enchondral bone during the spongiotic (active) phase.2⇓⇓–5 As the disease progresses to the inactive or sclerotic phase, these lesions undergo remineralization and can become indistinguishable on CT from the normal dense otic capsule.1⇓–3 Notably, otosclerotic foci are usually larger in volume than the bone they replace, causing thickening of the affected otic capsule.1
Diagnosis of otosclerosis is classically based on history, physical examination, and audiometric testing.6,7 High-resolution CT is the technique of choice to confirm the diagnosis and evaluate alternate diagnoses or coexisting diseases and for preoperative anatomic assessment.2,3,6,8 The aforementioned variable disease activity and the presence of sclerotic foci mimicking normal bone can make diagnosis of otosclerosis by CT challenging.
The purpose of this study was to assess the qualitative and quantitative differences in otic capsule contour and thickness just anterolateral to the anterior margin of the oval window in patients with otosclerosis and individuals with normal hearing on CT. We hypothesized that patients with otosclerosis have measurably thicker otic capsules near the oval window than individuals with normal hearing on CT.
Materials and Methods
Subjects
All CT studies of the temporal bone including multidetector row CT (MDCT) and conebeam CT (CBCT) performed at Massachusetts Eye and Ear Infirmary between January 2016 and June 2017 were retrospectively reviewed following institutional review board approval. Consecutive CTs of 58 patients with clinically diagnosed otosclerosis (104 ears) were included. Consecutive CTs of 54 patients (108 ears) with normal audiogram findings who underwent temporal bone CT for other indications (tinnitus, dizziness, vertigo, and facial palsy) were included. CTs of children (younger than 18 years of age) and CTs with motion degradation were excluded. Individual ears in both the otosclerosis and control groups were counted because some CBCT studies were performed unilaterally.
Image Acquisition
MDCT (Discovery 750 HD; GE Healthcare, Milwaukee, Wisconsin) of the temporal bone was performed with 120 kV(peak), 240 mA, 0.6-mm slice thickness, and 0.2-mm gap. CBCT (3D Accuitomo; J. Morito Mfg, Kyoto, Japan) of the temporal bone was performed with a 90-kVp, 8-mA, high-resolution mode with exposure time = 30.8 seconds, FOV = 60 × 60 mm, and slice thickness = 0.5 mm. Axial reformats of the temporal bones were created for both MDCT and CBCT studies in a plane parallel to the lateral semicircular canal.
Reader Assessment
Two radiologists independently determined the location of involvement (fenestral, and/or retrofenestral) for patients with otosclerosis. A subjective subgroup analysis was performed to characterize the phase of otosclerosis into sclerotic, mixed sclerotic-lucent, and lucent disease. The sclerotic phase of disease was characterized as disease that was similar to or near the density of the unaffected otic capsule, while lucent disease was characterized by disease that approached the density of the facial nerve. Mixed lucent sclerotic disease was grouped subjectively between the lucent and sclerotic phases of disease. Qualitative and quantitative assessments of the otic capsule were evaluated with the readers blinded to patient information, including presenting symptoms, audiogram results, and clinical diagnosis. Axial reconstructions through the temporal bone parallel to the entire lateral semicircular canal were confirmed in all cases.
Qualitative Assessment of the Otic Capsule
At the level of the oval window and cochleariform process, the otic capsule contour was classified into bulging or convex and flattened or concave configurations relative to an imaginary line drawn from the anterior margin of the oval window to the cochleariform process (Fig 1).

Qualitative description of the otic capsule contour relative to an imaginary line drawn from the anterior margin of the oval window to the cochleariform process. A, Normal temporal bone with a concave contour. B, Lucent phase of fenestral and retrofenestral otosclerosis with a flattened contour. C, Sclerotic phase of fenestral otosclerosis with a bulging or convex contour.
Quantitative Assessment of the Otic Capsule
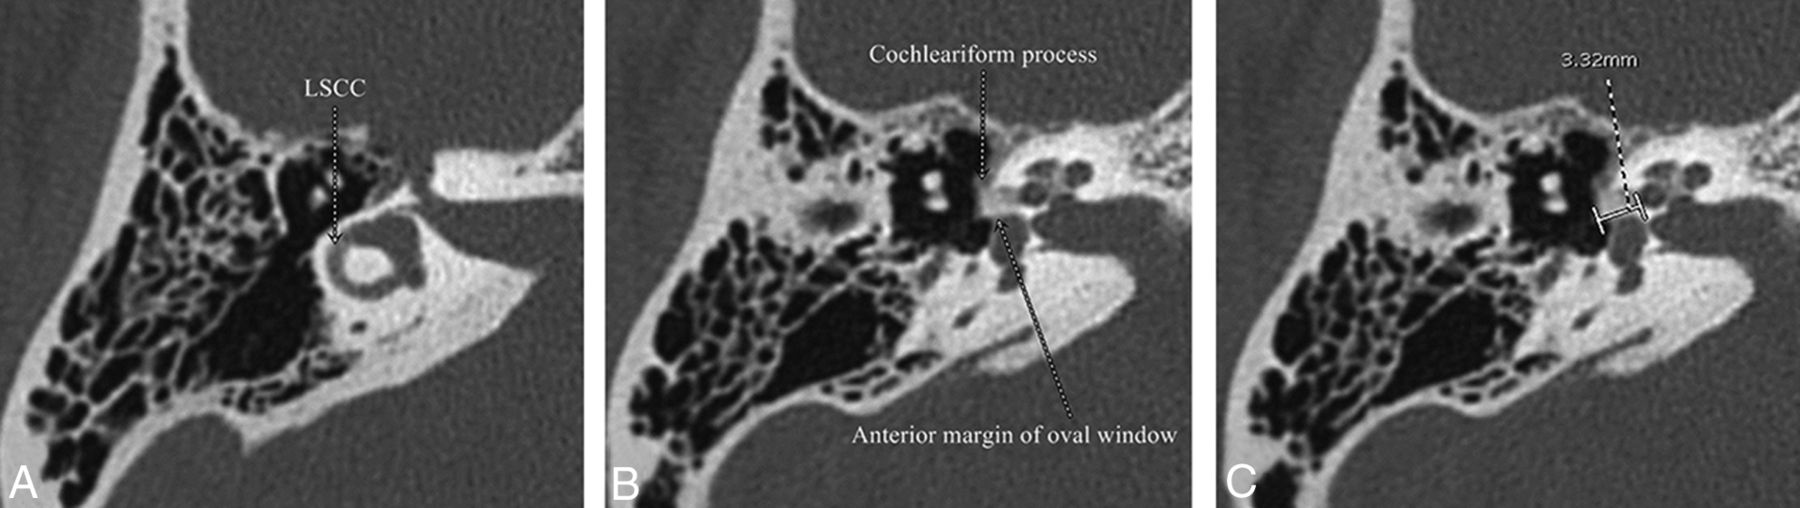
To quantitatively assess the otic capsule thickness using axial reformatted images that were parallel to the plane of lateral semicircular canal for standardization purposes, we chose the axial image at the level of oval window and cochleariform process. Measurements were made from the posterolateral margin of the cochlea closest to the middle ear (junction of the basal and middle turns) to the apex of the convex contour of the otic capsule just anterolateral to the anterior margin of the oval window (Fig 2). In the absence of a convex contour, the sulcus formed between the cochleariform process and oval window was identified, and a measurement was made to the depth of the sulcus, anterior to the oval window (Fig 3).

Measurement of otic capsule thickness from the posterolateral margin of the cochlea at the junction between the basal and middle turns to the most convex contour. A, Axial images parallel to the plane of the lateral semicircular canal (LSCC) are created. B, The axial slice at the level of the cochleariform process and anterior margin of the oval window is chosen. C, Measurement from the posterolateral margin of the cochlea at the junction of the basal and middle turns to the apex of the convex contour of the otic capsule is performed.

Measurement of otic capsule thickness in a patient without a convex contour of the otic capsule. A, Axial images parallel to the plane of the lateral semicircular canal (LSCC) are created. B, The axial slice at the level of the cochleariform process and anterior margin of the oval window is chosen. The sulcus between the cochleariform process and the anterior margin of the oval window is shown (white dashed line). C, Measurement from the posterolateral margin of the cochlea at the junction of the basal and middle turns to the depth of the sulcus anterior to the oval window is performed.
Statistical Analysis
The data were analyzed using R statistical and computing software, Version 3.3.3 (http://www.r-project.org/). The Fisher exact test was used to analyze differences in patient demographics between the patients with otosclerosis and those with normal hearing. A χ2 test with a Yates correction was used for the otic capsule contour 2-by-2 table. Mean thickness of the otic capsule and mean age of the patient populations were compared using the Student t test. A 1-way ANOVA test was used to evaluate differences in mean thickness among the subgroups of otosclerosis. A χ2test in a 2-by-3 table was used to evaluate differences between the phases of otosclerosis and the presence of a bulging/convex or flattened/concave contour. P < .05 indicated a statistically significant difference. A receiver operating characteristic curve analysis was used to determine the cutoff value of the otic capsule thickness that had the best combination of sensitivity and specificity for differentiating patients with otosclerosis from individuals with normal hearing. Interobserver reliability was evaluated using the Pearson product-moment correlation coefficient.
Results
Study Groups
The enrolled population characteristics, CT modalities, and types of otosclerosis are shown in Table 1.
Characteristics of the study groups
Qualitative Assessment of the Otic Capsule
Otic capsule contour in otosclerosis and normal hearing patients is shown in Table 2. Bulging or convex contour had 68.3% sensitivity, 98.1% specificity, 97.3% positive predictive value, and 76.3% negative predictive value (Table 3).
Otic capsule contour
Otic capsule contour and thickness for diagnosis of otosclerosis
Quantitative Assessment of the Otic Capsule
Patients with otosclerosis had significantly thicker otic capsules near the oval window (P < .001) measured from the posterolateral margin of the cochlea lumen closest to the middle ear (junction of the basal and middle turns) to the apex of the convex contour (Table 4).
Mean otic capsule thickness in millimeters (2 SDs)
Interobserver agreement was excellent with the Pearson product-moment correlation coefficient = 0.93 for measurement of otic capsule thickness in patients with otosclerosis and individuals with normal hearing.
In addition, a subgroup analysis based on a subjective phase of otosclerosis was performed (Table 5). There was no statistically significant difference between otic capsule thickness or contour type based on the phase of otosclerosis.
Overall mean otic capsule thickness in millimeters (2 SDs) and percentage of patients with a bulging/convex contour by phase of otosclerosis
Furthermore, we determined the cutoff value of otic capsule thickness using a receiver operating characteristic curve analysis. Otic capsule thickness of >2.3 mm showed the best trade-off between sensitivity and specificity to distinguish otosclerosis from individuals with normal hearing (Table 3). The area under the receiver operating characteristic curve was 0.99.
Discussion
The otic capsule is composed of an inner layer of endosteum, a middle layer of persistent primary enchondral bone, and an outer layer of periosteum. Normally, the otic capsule does not undergo postdevelopmental remodeling.1 However, during the active or spongiotic phase of otosclerosis, the dense middle layer of enchondral bone is resorbed and replaced by spongy vascular bone, resulting in lower density on CT.1,5,9 During the inactive phase, the affected areas of otosclerosis undergo new bone formation, thus mimicking the density of normal bone on CT.2,9 Our study hypothesis is based on the pathophysiology that otosclerotic foci undergo continuous resorption and remodeling, eventually resulting in production of more mature bone, often larger than the original affected area, thus leading to focal thickening of the otic capsule.1,9 Thus, our study included all consecutive patients with clinically diagnosed otosclerosis regardless of the phase of disease. Because the otic capsule adjacent to the anterior margin of the oval window is expected to enlarge with remodeling, this bone should be thicker in patients with otosclerosis compared with individuals with normal hearing regardless of the phase of disease. Our study demonstrated that there was no significant difference between the phase of otosclerosis and the thickness of the otic capsule contour. In addition, there was no significant difference between the phase of otosclerosis and the presence of a bulging/convex contour.
We found that a bulging or convex contour of the otic capsule across an imaginary line drawn from the anterior margin of the oval window to the cochleariform process had 98.1% specificity and 97.3% positive predictive value. The high specificity suggests that individuals with normal hearing are unlikely to have a bulging or convex contour and that this technique is a good diagnostic tool to rule in disease. Although predictive values are influenced by prevalence, this high positive predictive value can imply that patients with a bulging or convex contour have a high probability of otosclerosis. This finding is consistent with the bone remodeling, deposition, and thickening of the otic capsule seen in otosclerosis on histology.1 In addition, this finding is compatible with the clinical symptoms of conductive hearing loss as the normal sulcus immediately anterolateral to the oval window is lost, resulting in stapes fixation and impedance of sound.
For quantitative assessment, otosclerosis resulted in a significantly thicker otic capsule near the oval window than in individuals with normal hearing (P < .001). Otic capsule thickness of >2.3 mm of the most convex contour provided the best trade-off between sensitivity and specificity and is also >3 SDs from the average otic capsule thickness in individuals with normal hearing. This finding is an objective evaluation with excellent interobserver agreement of 93%, high discriminative power, and an area under the receiver operating characteristic curve of 0.99. Using a cutoff of otic capsule thickness of >2.3 mm from the posterolateral margin of the cochlea lumen closest to the middle ear (junction of the basal and middle turns) to the most convex contour resulted in high values of all statistical measures including 96.2% sensitivity, 100% specificity, 100% positive predictive value, and 96.4% negative predictive value. Retrospective review of the imaging in the 4 ears with otosclerosis and false-negative results on CT based on the 2.3-mm cutoff revealed small lucent fenestral lesions in 3 ears and 1 ear that had only round window disease present. Overall, this standardized measurement value of 2.3 mm is a good diagnostic tool to help recognize patients with otosclerosis.
Our otosclerosis population corresponds well to previous reports in terms of sex and age predilection as well as type of otosclerosis.1⇓⇓–4,10⇓⇓⇓–14 There were no significant differences between the patients with otosclerosis and those with normal hearing in terms of sex. There was a significant difference in terms of age between the 2 groups with the normal-hearing group being younger than the patients with otosclerosis. However, otosclerosis is a disorder of the enchondral bone,1 and the enchondral bone of the otic capsule anterior to the oval window is expected to be largely ossified by term infancy with the exception of the cartilage immediately surrounding the fissula ante fenestram, which is one of the last parts of the otic capsule to ossify.15 Small pericochlear lucencies can be seen in children,16,17 but these would not be expected to affect the otic capsule contour or the overall thickness of the otic capsule. Because our patients were adults, we would not have expected differences related to the age of the patients. Most interesting, 1.9% of patients with otosclerosis had isolated round window lesions without associated disease anterior to the oval window, a higher percentage than reported in prior literature.18 Although imaging may not be necessary in the diagnosis of patients who present with characteristic clinical findings and typical audiometric test findings,9 imaging is helpful for the diagnosis in cases of sensorineural or mixed hearing loss, evaluating other differential diagnoses or coexisting diseases, and preoperative anatomic assessment.2,3,6,8 Most of our patients underwent imaging for preoperative evaluation before stapes prosthesis and cochlear implant insertion for fenestral and retrofenestral otosclerosis, respectively.
There was a statistically significant difference between patients with otosclerosis who underwent CBCT versus MDCT in patients with normal hearing. This was expected because there is a trend at our institution to perform more CBCT for patients with conductive hearing loss. MDCT is preferred at our institution for the entities commonly seen in the normal-hearing population, including facial paralysis and vertigo. We would not expect a difference in terms of measurement based on the 2 modalities.
Prior literature has suggested that MDCT and CBCT are limited in cases of tiny foci of <1 mm, superficial foci, inactive disease, and density variation of <200 HU.19⇓⇓–22 In addition, CBCT has been found to have a 0% sensitivity for detection of otosclerosis in the sclerotic phase; however, detection was based on a visual grading system with no standardized measurement techniques used.19 As in our study, Swartz et al23 described the presence of a bony excrescence or a bulging contour of the otic capsule anterior to the oval window as a helpful finding in otosclerosis; however, the interval improvement in MDCT technology now enables reproducible quantitative measurements in standardized planes, improving accuracy and reproducibility. A recent systematic review suggests that high-resolution CT has a low sensitivity of 58%, high specificity of 95%, and a high positive predictive value of 92% but is limited in submillimeter disease, retrofenestral disease, and dense sclerotic lesions.24 Our study improves the sensitivity and specificity for the diagnosis of otosclerosis using a standardized plane and clearly defined landmarks for quantitative assessment of the otic capsule, regardless of phase of disease.
A limitation of this study was that there was no histologic confirmation of disease as a definitive diagnosis of the degree of disease activity. However, our patients met clinical features sufficient to confirm otosclerosis. In addition, the characterization of the phase of disease was subjective on the basis of perceptual differences in otic capsule density. While there are currently no quantitative measures of CT density to define the different phases of disease, our study shows that the thickness of the otic capsule and the presence of a bulging contour are independent of the phase of disease. In addition, our patients with otosclerosis had undergone either an MDCT or CBCT but not both; thus, we could not compare the 2 modalities. Additional study may provide this information to support decision-making for the choice of CT imaging modalities. In addition, submillimeter foci of otosclerosis may be too small to result in a contour bulge or significant thickening of the otic capsule; however, these lesions may be less likely to result in conductive hearing loss. Another limitation is that this study was performed at 1 institution. While our study showed excellent interobserver reliability, further studies at other institutions may help confirm reproducibility. Finally, other osteodystrophies could produce a bulging contour, though entities such as Paget disease would not be expected to involve only the area anterior to the oval window.
Conclusions
Using a standardized axial plane parallel to the lateral semicircular canal, a bulging or convex contour of the otic capsule relative to a line drawn between the anterior margin of the oval window and the cochleariform process occurred with high specificity and positive predictive value in patients with otosclerosis. The otic capsule along the anterior margin of the oval window at the level of the cochleariform process is significantly thicker in patients with otosclerosis compared with individuals with normal hearing. Use of a quantitative assessment of the otic capsule may help the radiologist accurately diagnose otosclerosis.
Footnotes
Disclosures: Katherine L. Reinshagen—RELATED: Grant: National Institutes of Health award, Comments: This work was conducted with support from Harvard Catalyst and the Harvard Clinical and Translational Science Center (National Center for Advancing Translational Sciences, National Institutes of Health award UL 1TR002541) and financial contributions from Harvard University and its affiliated academic health care centers. The content is solely the responsibility of the authors and does not necessarily represent the official views of Harvard Catalyst, Harvard University and its affiliated academic healthcare centers, or the National Institutes of Health.* Hugh D. Curtin—UNRELATED: Royalties: Elsevier. *Money paid to the institution.
This work was supported by Harvard Catalyst and the Harvard Clinical and Translational Science Center (National Center for Advancing Translational Sciences, National Institutes of Health award UL 1TR002541) and financial contributions from Harvard University and its affiliated academic health care centers.
The content of this article is solely the responsibility of the authors and does not necessarily represent the official views of Harvard Catalyst, Harvard University and its affiliated academic health care centers, or the National Institutes of Health.
Indicates open access to non-subscribers at www.ajnr.org
References
- Received July 31, 2018.
- Accepted after revision September 29, 2018.
- © 2018 by American Journal of Neuroradiology


