
Abstract
BACKGROUND AND PURPOSE: MR fingerprinting allows rapid simultaneous quantification of T1 and T2 relaxation times. This study assessed the utility of MR fingerprinting in differentiating common types of adult intra-axial brain tumors.
MATERIALS AND METHODS: MR fingerprinting acquisition was performed in 31 patients with untreated intra-axial brain tumors: 17 glioblastomas, 6 World Health Organization grade II lower grade gliomas, and 8 metastases. T1, T2 of the solid tumor, immediate peritumoral white matter, and contralateral white matter were summarized within each ROI. Statistical comparisons on mean, SD, skewness, and kurtosis were performed by using the univariate Wilcoxon rank sum test across various tumor types. Bonferroni correction was used to correct for multiple-comparison testing. Multivariable logistic regression analysis was performed for discrimination between glioblastomas and metastases, and area under the receiver operator curve was calculated.
RESULTS: Mean T2 values could differentiate solid tumor regions of lower grade gliomas from metastases (mean, 172 ± 53 ms, and 105 ± 27 ms, respectively; P = .004, significant after Bonferroni correction). The mean T1 of peritumoral white matter surrounding lower grade gliomas differed from peritumoral white matter around glioblastomas (mean, 1066 ± 218 ms, and 1578 ± 331 ms, respectively; P = .004, significant after Bonferroni correction). Logistic regression analysis revealed that the mean T2 of solid tumor offered the best separation between glioblastomas and metastases with an area under the curve of 0.86 (95% CI, 0.69–1.00; P < .0001).
CONCLUSIONS: MR fingerprinting allows rapid simultaneous T1 and T2 measurement in brain tumors and surrounding tissues. MR fingerprinting–based relaxometry can identify quantitative differences between solid tumor regions of lower grade gliomas and metastases and between peritumoral regions of glioblastomas and lower grade gliomas.
ABBREVIATIONS:
- CW
- contralateral white matter
- GBM
- glioblastoma multiforme
- IDH1
- isocitrate dehydrogenase 1
- LGG
- lower grade glioma
- MET
- metastasis
- MRF
- MR fingerprinting
- PW
- peritumoral white matter
- ST
- solid tumor
Glioblastoma multiforme is the most common malignant primary brain tumor with an age-adjusted incidence rate of 3.19/100,000.1,2 Brain metastases account for 48%–51% of all intracranial neoplasms, with an annual incidence of 8.3–14.3/100,000.2,3 Early differentiation between primary and metastatic malignant brain tumors ensures selection of appropriate diagnostic and management options and also provides accurate prognostic information early in the course of management.3,4 The ability to differentiate primarily vasogenic edema (as seen around metastatic lesions) and edema with neoplastic cellular infiltration (as seen around glioblastomas) can allow accurate delineation of the tumor margin and aid therapeutic planning and has the potential to positively affect patient outcome.5 More fundamentally, it is necessary to understand the differences among biologic characteristics of various tumor types to better comprehend complex aggressive tumor behavior and lack of response to treatment, particularly in the case of glioblastomas.6 Advanced MR imaging studies such as perfusion imaging, diffusion tensor imaging, and MR spectroscopy have demonstrated some utility in discriminating brain metastases from glioblastomas and identifying areas of peritumoral infiltration.7⇓⇓⇓⇓⇓⇓–14 However, there remains a need for a simple, rapid, quantitative, and noninvasive method to probe tissue characteristics in patients with brain tumors by exploiting subtle changes in the microenvironment that may not be appreciated by the human eye on standard qualitative clinical images.
MR fingerprinting (MRF) is a recently introduced MR imaging technique in which pseudorandomized acquisition parameters are used to simultaneously quantify multiple tissue properties, including T1 and T2 relaxation times.15 The sequence design results in a signal evolution in each voxel, which depends on the T1 and T2 of tissue in that voxel. On the basis of Bloch equations, a dictionary of all possible signal evolutions is simulated with acquisition parameters from the used sequence and all possible T1 and T2 combinations. Selecting the dictionary entry that is best correlated with the voxel signal time course identifies the best dictionary match for each voxel. The T1 and T2 times used to construct the dictionary entry are identified as the relaxation time measurements for that voxel.15⇓–17
In this study, we evaluated the ability of MR fingerprinting–derived T1 and T2 relaxometry to differentiate the 3 common types of intra-axial brain tumors (glioblastomas, lower grade gliomas, and metastases). Using these parameters, we also explored the T1 and T2 properties of peritumoral white matter in various tumor types.
Materials and Methods
This Health Insurance Portability and Accountability Act–compliant study was approved by the institutional review board and was performed at University Hospitals Cleveland medical center as a part of larger prospective protocol evaluating preliminary applications of MRF. Informed written consent was obtained from all participants. The inclusion criterion was the presence of an untreated intra-axial neoplasm. Exclusion criteria were all contraindications for MR imaging.
Subjects
Thirty-one patients with newly diagnosed brain tumors were included. Seventeen patients with glioblastoma multiforme (GBMs), 8 with metastases (METs), and 6 with WHO grade II glial neoplasms (lower grade gliomas [LGGs]) were included in this study. The LGG group included 5 oligodendrogliomas and 1 oligoastrocytoma. One of the patients with brain metastasis presented with an unknown primary malignancy and was later diagnosed with adenocarcinoma of the esophagus. The primary malignancies in other patients with brain metastases included adenocarcinoma of the lung, breast, colon, and esophagus and 1 case of melanoma. The metastatic melanoma lesion included in this study did not show hyperintense signal on precontrast T1-weighted images. One of the patients with GBM had undergone a stereotactic biopsy sampling from a portion of the tumor at an outside institution before MR fingerprinting; the biopsy tract was well-defined and was avoided during the ROI analysis. There was no other history of brain surgery, radiation, or significant cerebral trauma in any of the participants. In patients with metastases, 5 had not received any systemic therapy; 2 had completed systemic chemotherapy 2 and 5 months, respectively, before the appearance of brain metastasis; and 1 patient with breast cancer developed a brain metastasis while on systemic chemotherapy for the primary malignancy. The final histopathologic diagnosis was available in all patients (13 total resections, 16 partial resections, and 2 biopsies). Patient demographics, including age and sex, were noted; note was also made if patients had been treated with steroids at the time of MRF imaging. For all gliomas, isocitrate dehydrogenase 1 (IDH1) status was assessed by using a monoclonal antibody to IDH1 R132.
MR Imaging and Processing
All patients were scanned at 3T (Verio and Magnetom Skyra; Siemens, Erlangen, Germany) by using a 20-channel head coil. MRF acquisitions were incorporated in a clinical MR imaging brain study and were acquired before gadolinium-based contrast agent administration in all subjects. The MRF acquisition was planned on whole-brain clinical standard FLAIR images and, depending on the tumor size, 3–5 MRF sections were acquired through each lesion. The MRF acquisition consisted of a True FISP sequence with parameters as follows; FOV, 300 × 300 mm2; matrix, 256 × 256; section thickness, 5 mm; flip angle variable, 0°–60°; TR variable, 8.7–11.6 ms; sinc radiofrequency pulse with a duration of 800 μs; and a time-bandwidth product of 2. For every section, 3000 time points were acquired with a total acquisition time of 30.8 seconds.15
A dictionary of signal evolutions that could arise from the pulse sequence by using all possible combinations of T1, T2, and off-resonance frequency was generated with a total of 287,709 signal time courses. The ranges of T1 and T2 were chosen on the basis of potentially encountered ranges of these properties, with T1 values between 100 and 3000 ms and T2 values between 10 and 500 ms. The total simulation time was 5.3 minutes. The vector dot product between the measured signal and each dictionary entry was calculated, and the entry yielding the highest dot product was selected as the closest match to the acquired signal.15 The final output consisted of T1, T2, proton-density, and off-resonance maps for each section, of which only T1 and T2 maps were used for quantitative analysis.
ROI Analysis
A fellowship-trained neuroradiologist (reader 1) who was blinded to the final pathology analyzed the quantitative T1 and T2 maps as follows: Of 31 patients scanned, all GBMs and METs demonstrated enhancement on postgadolinium T1-weighted images, 2 of 6 LGGs were completely nonenhancing, and the remaining 4 LGG lesions showed patchy minimal enhancement. ROIs were drawn in 3 specific areas for each tumor with axial FLAIR and postcontrast T1-weighted images for reference. The solid tumor (ST) region was defined as the enhancing region in tumors with postcontrast enhancement or an expansile FLAIR hyperintensity region in nonenhancing/minimally enhancing tumors. The peritumoral white matter (PW) region was defined as white matter within 1 cm of the enhancing or expansile FLAIR hyperintense tumor margin. One patient with GBM was excluded from the solid tumor analysis because the entire tumor was necrotic with a thin enhancing rim and had no solid-appearing component. In a cerebellar metastatic lesion, the solid tumor measurements were excluded because the entire tumor had hemorrhagic products within. The peritumoral region measurements for these 2 patients were included in the analysis.
The largest possible ROIs were drawn in ST and PW regions that met the previously outlined criteria, while excluding areas of hemorrhage, calcification, or necrosis in these regions. ROIs drawn in PW were restricted to white matter regions while avoiding inclusion of gray matter structures. Finally, contralateral white matter (CW) regions were defined as normal-appearing white matter in the contralateral hemisphere, excluding nonspecific white matter signal abnormalities in older patients. If normal-appearing white matter was not available in the same lobe in the contralateral hemisphere, the ROI was placed in another contralateral lobe. The size of the ROI depended on the lesion size and homogeneity and ranged from 0.32 to 12 cm2 (median, 1.7 cm2) for ST, from 0.25 to 2.5 cm2 (median, 0.96 cm2) for PW, and from 0.16 to 2.0 cm2 (median, 1.0 cm2) for CW. Areas with imaging artifacts (in 1 patient) and prior biopsy tracts (in 1 patient) were avoided. Utmost care was taken to follow the region criteria and avoid partial volume averaging with different tissue types in the vicinity. The output of this analysis consisted of distributional summary parameters for each ROI based on T1 and T2 relaxation times of each voxel within the ROI. ROI output from reader 1 was exclusively used for all statistical analysis. All data processing and analysis were performed in Matlab (MathWorks, Natick, Massachusetts).
Interobserver Concordance
A second reader (a board-certified radiologist, also blinded to the final pathology) delineated ROIs in ST and PW regions of all tumors. The measurements from reader 2 were used only for assessment of interobserver concordance. The ROIs of readers 1 and 2 were compared by means of the Pearson correlation coefficient and intraclass correlation coefficient.
Statistical Analysis
For tumor analysis, distributional parameters were calculated as an output of ROI analysis, including mean, median, mode, SD, skewness, kurtosis, and 10th, 25th, 75th, and 90th percentile values. While the mean, median, and mode are measures of central tendency, the SD measures variability, skewness measures lack of symmetry in the distribution of T1 or T2 across voxels, and the kurtosis measures whether the distribution is heavy-tailed or light-tailed relative to the normal distribution. Pearson correlation coefficients among the mean, median, mode, and 10th, 25th, 75th, and 90th percentiles by type of tissue (ST, PW, or CW) were above 0.90 with many >0.95, indicating that examination of multiple measures from this group would likely be redundant and 1 representative measure could be used instead (see the On-line Appendix and On-line Tables 1–6 for correlation analysis). The mean was selected from all the highly correlated parameters because it is conventionally the most commonly used measure of central tendency. On the other hand, the SD, skewness, and kurtosis were not highly intercorrelated with each other or with the central tendency and percentile measures. Thus, the mean, along with SD, skewness, and kurtosis, were selected for further analyses. These parameters (mean, SD, skewness, and kurtosis) were examined to compare ST and PW regions from each tumor group with the CW. The Wilcoxon signed rank test was used for this analysis. Wilcoxon rank sum tests were used to compare mean, SD, skewness, and kurtosis of ST and PW regions across the 3 tumor types. All results were corrected for multiple-comparison testing by using the Bonferroni correction method, and results significant both with and without multiple-testing correction are reported. With the Bonferroni correction, statistical significance was reached if the P value was <0.05/k, where k = number of tests. When comparing tumor types, we set k to 12 (3 pair-wise comparisons × 4 parameters), and when comparing tumors versus CW, k was set to 8 (2 ROIs × 4 parameters), resulting in thresholds for statistical significance of P < .0042 and .0063, respectively. Multiple logistic regression analysis with a forward stepwise selection model was used to examine which parameters were the best predictors for distinguishing GBMs and METs. At a given step, the most significant predictor with P < .05 was entered. The area under the receiver operating characteristic curve was calculated by using the predicted probability from this model as a classifier. All statistical analyses were performed by using SAS 9.4 software (SAS Institute, Cary, North Carolina).
Results
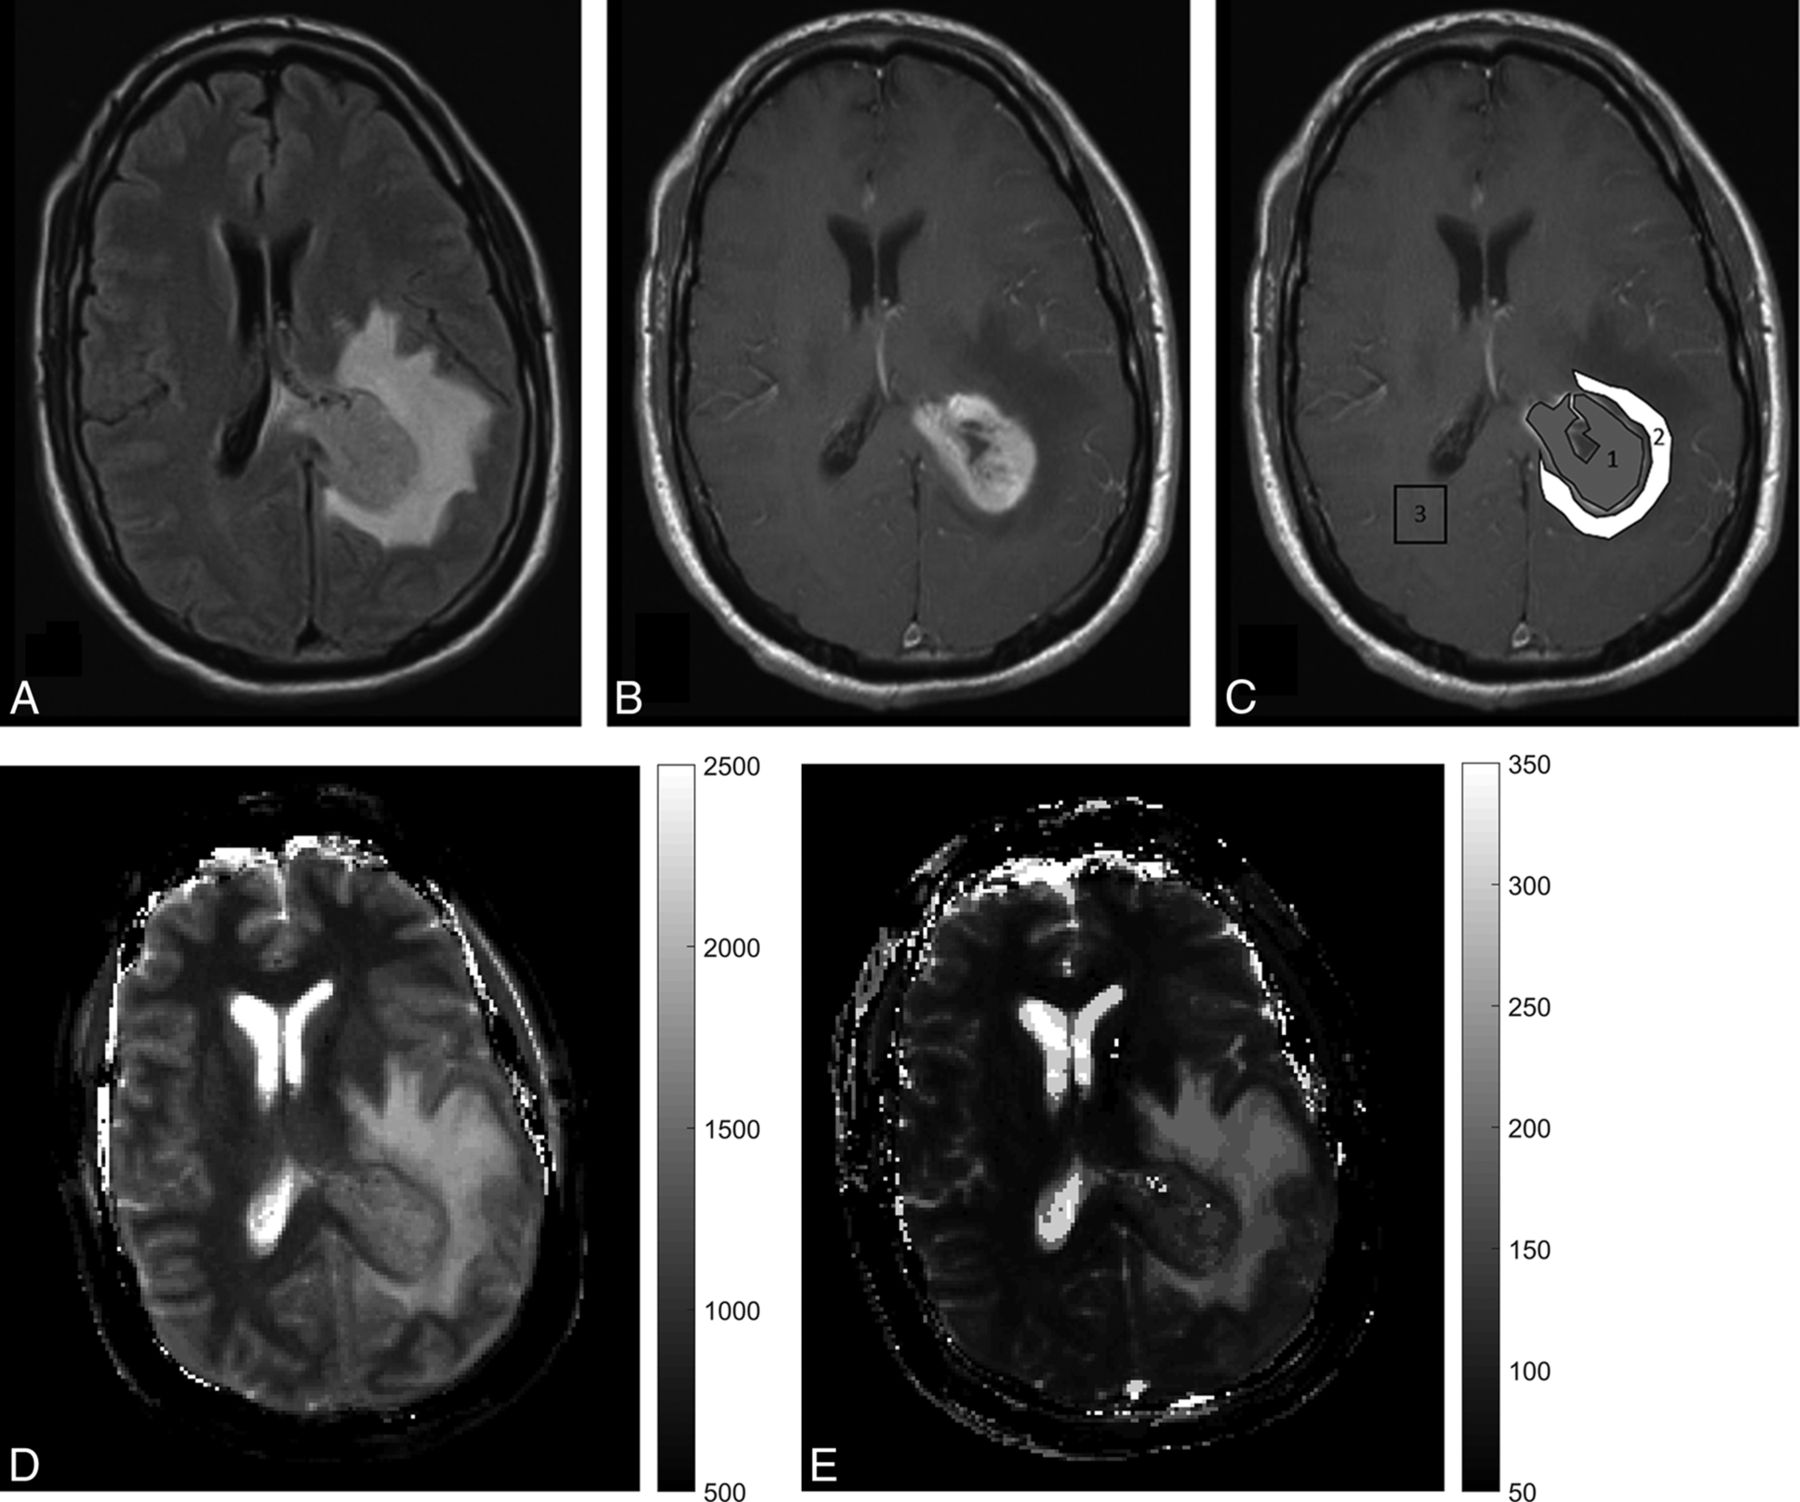
Table 1 summarizes patient demographics for the 3 tumor groups. Patients with lower grade gliomas were younger compared with patients with GBMs and metastases, as expected. Among the 3 tumor groups, there were no differences in the proportion of patients on steroids. There were no differences in T1 and T2 values between patients with and without steroid treatment when compared by tumor type. There were no differences in CW measurements for the 3 groups to suggest significant age effects on normal brain parenchyma (data not shown). All GBMs were negative for IDH1, whereas 4 of 6 LGGs were positive for IDH1. Figure 1 is an example of MRF-derived T1 and T2 maps and ROI delineation in 1 of the study participants with an enhancing brain tumor. Another example of ROI delineation in a nonenhancing brain tumor is provided in the On-line Figure.
Patient demographics

A study patient, a 45-year-old man presenting with severe headaches and altered sensorium with glioblastoma. A and B, FLAIR and contrast-enhanced T1-weighted images from the clinical scan, which demonstrate a left periatrial enhancing lesion with peritumoral FLAIR hyperintensity. C, Postcontrast T1-weighted image with ROI overlay. The central gray ROI shows a solid enhancing tumor region, the white ROI shows a peritumoral white matter region, and the blank ROI in the contralateral hemisphere denotes the contralateral white matter measurement. D and E, MRF-derived quantitative T1 and T2 maps.
The means and SDs of the mean, SD, skewness, and kurtosis parameters for T1 and T2 for solid/enhancing regions of different tumor types are outlined in Table 2. For all tumor types combined, the mean and SD based on T1 and T2 of solid tumor regions were significantly different from contralateral white matter, even after adjusting for multiple comparison testing (Table 2).
Mean ± standard deviation of mean, SD, skewness, and kurtosis of T1 and T2 from various tumor regions and contralateral white matter in 3 tumor types with results from the Wilcoxon rank sum testa and the Wilcoxon signed rank testb
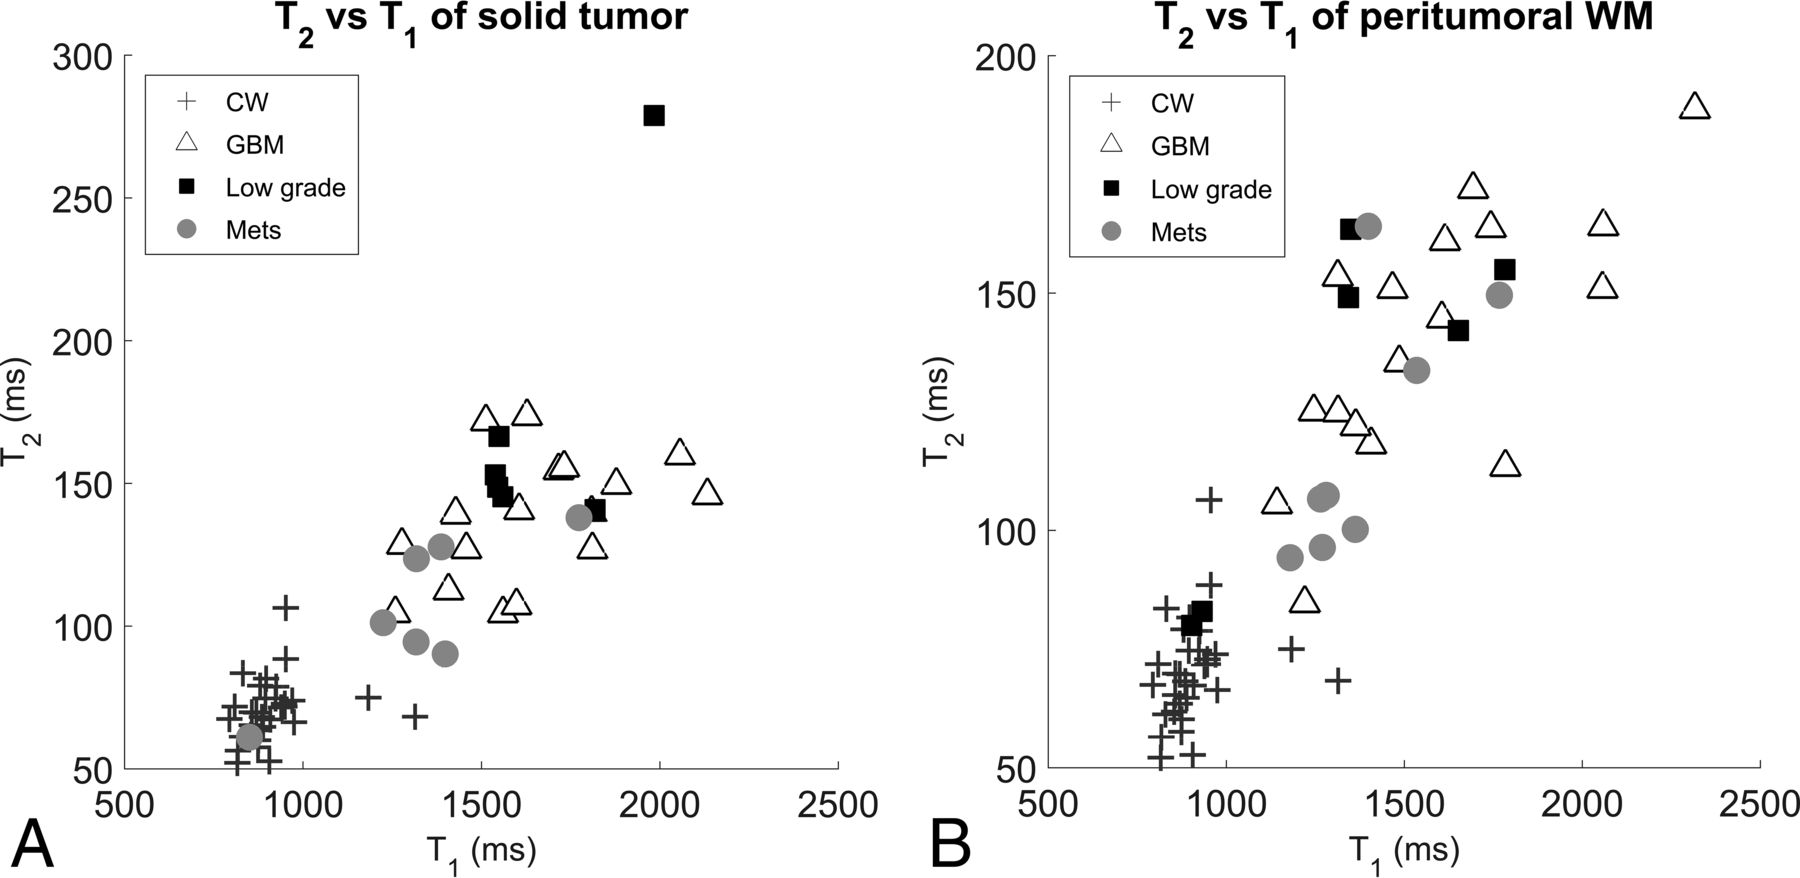
The mean and SD of the PW region of GBMs were significantly different when compared with the CW with P < .0001. The comparison of the mean of the PW region of METs and CW yielded a P = .0078; this was not significant after multiple-comparison correction. There were no differences between the mean and SD of the PW of LGGs compared with CW. Figure 2 is a scatterplot of mean T1 versus T2 of ST and PW regions of all tumor types with contralateral white matter measurements.

Scatterplot of T1-versus-T2 measurements in all tumor types for the solid tumor region (A) and the peritumoral white matter region (B).
Wilcoxon rank sum test analysis of ST and PW regions of GBMs versus METs showed differences between multiple histogram parameters for T1 and T2 only before Bonferroni correction (Table 2). Analysis of ST regions of GBMs versus LGGs showed no significant difference in nearly all T1 and T2 parameters (except T2 skewness). There were, however, several differences between GBMs and LGGs when T1 and T2 parameters of peritumoral white matter were compared, with differences in mean T1 remaining significant even after Bonferroni correction. Lastly, several ST and PW region parameters were significantly different between LGGs and METs, with differences in the mean T2 of ST remaining significant even after Bonferroni correction.
On the basis of a stepwise selection model for multiple logistic regressions to differentiate between GBMs and METs, the best differentiation was obtained by using the single-predictor mean T2 relaxometry of the ST region. With this parameter, the area under the ROC curve was 0.86 (95% CI. 0.69–1.00) with a P value < .0001. When added individually to the model with a mean T2 from the ST region, none of the other parameters significantly improved the ability of the model to discriminate GBMs and METs.
Interobserver Concordance
The Pearson correlation coefficients for T1 and T2 of the ST region were 0.90 and 0.83, respectively, and the Pearson correlation coefficients for T1 and T2 of the PW region were 0.88 and 0.91, respectively. According to the guidelines for clinical significance, intraclass correlation coefficients for all measures (ST T1, ST T2, PW T1, and PW T2) were excellent (intraclass correlation coefficients = 0.90, 0.83, 0.88, and 0.89, respectively).18
Discussion
This study describes the application of MRF in quantifying tissue relaxation times in primary glial and metastatic brain tumors. MRF can identify quantifiable relaxometry differences between solid tumor regions of lower grade gliomas and metastatic brain lesions. MRF relaxometry also identifies significant differences in the peritumoral region of GBMs compared with LGGs.
A variety of advanced imaging techniques, including perfusion imaging, DTI, MR spectroscopy, and molecular imaging such as positron emission tomography, have been used for advanced brain tumor evaluation during the past decade with mixed success.7⇓⇓⇓⇓⇓⇓–14 In particular, perfusion imaging has been shown to have utility in differentiating metastases from GBMs and in differentiating various glioma grades.8,11 DTI has shown promising results for tumor margin delineation and identification of tumor infiltration.12,14 PET imaging with FDG has been modestly successful in differentiating glioma grades but remains limited in utility because of a lack of specificity and significant background uptake.19,20 Molecular imaging with newer PET agents holds significant promise; however, it needs further evaluation with larger scale studies.20⇓–22 Despite all these advances, no single neuroimaging technique has emerged that can be easily, reliably, and consistently used in a day-to-day setting to differentiate intra-axial brain tumors on the basis of both their origin and histopathologic grading. The problem of tissue discrimination is even more challenging in a posttherapy setting in which there is the possibility of pesudoprogression, pseudoresponse, and development of radiation necrosis.23,24 Although a combination of these sophisticated neuroimaging techniques along with conventional MR imaging can improve different aspects of brain tumor diagnostics, they involve significant financial and time limitations and technical challenges.23⇓–25
MRF is a new technique that provides multiparametric quantitative information in an ultrafast single acquisition, which can be easily performed in the framework of a present day clinical setup.15⇓–17 Recent studies have looked into improving on the MRF acquisition parameters to make them more robust, improving the reconstruction algorithms, and acquiring newer quantitative parameters from this technique.26⇓–28 Given its multiparametric capabilities and repeatability, this technique has the capability of becoming a useful MR imaging biomarker.29,30 Although the clinical applications and utility of this technique have not been assessed so far, the in vivo quantitation data in healthy volunteers and patients are emerging.31⇓–33
Differentiation between GBM and solitary metastasis by using conventional imaging can be challenging due to several overlapping imaging characteristics, and surgical sampling is frequently necessary for the final diagnosis. While the history of previous malignancy and the multiplicity of lesions is usually a reliable indicator of brain metastases, recent studies suggest that about 14% of all patients with brain metastases have an unknown primary malignancy and up to 46% of patients present with a single brain metastasis.2,3 Conversely, by using modern MR imaging techniques, nearly 35% of patients with newly diagnosed GBM have multiple enhancing lesions, significantly higher than previous estimates, which ranged from 0.5% to 20%.34 Early differentiation of primary and metastatic malignant brain tumors is essential for prompt, appropriate, and cost-efficient diagnosis and treatment; coordination of multidisciplinary care; and assessment for clinical trials.3,4 Our results demonstrate that MRF-derived relaxometry may be useful in differentiating solid tumor regions of lower grade gliomas and metastases.
While the differences between solid tumor regions of GBMs and metastases neared significance, there were no significant differences between ST regions of LGGs and GBMs. T1 and T2 values of tissue depend on local cellularity, water content, structural organization, and the presence and concentration of lipids, proteins, macromolecules, and paramagnetic substances.35 The relaxometry differences between ST regions of LGGs and METs probably reflect differences based on the distinct tissue of origin in the 2 groups and a higher concentration of certain lipids and macromolecules in glial lesions.9,36 Lack of demonstrable T1 and T2 differences between solid tumor regions of LGGs and GBMs also suggests that these values are probably driven by the type of cellularity and tissue of origin; and given the common glial origin, it may be difficult to differentiate different grades of gliomas. The role of lineage cannot be assessed in this study given the lack of subjects with pure astrocytoma pathology of a single grade. The subtle differences in skewness of T2 between GBMs and LGGs could potentially be a reflection of higher cellular density, anaplasia, or microvascular proliferation in GBMs compared with LGGs.37⇓–39 Although the observed differences in T1 and T2 relaxation times of different tumor types are not entirely unexpected on the basis of our knowledge of qualitative images, being able to evaluate these differences quantitatively may be of potential benefit not only in the diagnosis and grading of brain tumors but also for other purposes such as treatment planning, monitoring therapy, and recurrence assessment.
Several pathologic and imaging studies have shown that the peritumoral white matter of glial tumors and METs differs in cellular and molecular content.35⇓⇓⇓–39 Metastatic lesions have little evidence of histologic invasion and are primarily surrounded by vasogenic edema beyond the contrast-enhancing margins. Conversely, the FLAIR signal abnormality beyond the enhancing margins in gliomas, particularly GBMs, contains infiltrative cells mixed with vasogenic edema.13,40⇓⇓⇓–44 The presence of neoplastic cells has also been identified in peritumoral regions as far as 2.5 cm from the enhancing tumor margin in white matter regions without any corresponding signal abnormality on T2-weighted images.14,40 Thus, CT and conventional MR imaging are not helpful in establishing tumor margins in gliomas in general and GBMs in particular. In our study, the ROIs in the peritumoral white matter were drawn to encompass white matter located within 1 cm of the enhancing margin/expansile FLAIR margin of the tumor. With this method, differentiation between ST and PW regions of FLAIR hyperintense tumors is particularly challenging. The T1 difference between the PW of GBMs and LGGs could potentially be influenced by the ROI technique used in this study. Further work with a larger sample size and perhaps an automated ROI delineation technique will be useful to verify whether discrepant tissue characteristics can indeed be reflected in measurable T1 differences. Analysis of PW in our study also reveals some additional subtle trends alluding to the heterogeneity of PW in GBM compared with METs and LGGs, with nonsignificant differences in SD and skewness. Carefully designed larger sample size prospective studies with 3D volumetric MRF acquisition and targeted histologic correlation are necessary to identify quantifiable differences in PW of various tumor types and to better understand the exact histopathologic correlates of these findings.
Several studies have used MR relaxometry for brain tumor diagnosis in the past with mixed success.45⇓⇓⇓⇓⇓–51 Recently, there has been renewed interest in evaluating the role of relaxometry in the assessment of nonenhancing tumor burden and response to antiangiogenic drug therapy.52⇓⇓–55 Although most of these recent studies focus on the role of T2 relaxometry, a recent study has demonstrated that T1 mapping may play a significant role in earlier detection of recurrent tumor in patients on antiangiogenic therapy. MRF differs from the methodology used in these studies in a few respects. MRF is a rapid imaging technique that allows simultaneous T1 and T2 measurements from a single acquisition in <30 seconds. The initial phantom studies have demonstrated better accuracy and efficiency compared with standard T1 and T2 measurement techniques.7 A recent article demonstrated the in vivo sensitivity of MRF in identifying aging-related changes in asymptomatic volunteers.32 The newer FISP-based sequence is less susceptible to field inhomogeneities compared with the True FISP–based acquisition used in this study and could serve as a robust quantitation tool for future studies.16,17 Development of a rapid 3D MRF technique has opened avenues for whole-brain coverage with near-isotropic spatial resolution with the potential for applications in tumor imaging and beyond.56
There are some limitations to this proof-of-concept study, including the small sample size, heterogeneity of the study population and tumor type, and lack of correlation of the imaging findings with genomic and molecular markers. The authors acknowledge that given the small sample size, even a few outliers could influence the study outcome significantly; therefore, it is difficult to draw any definite conclusions from these results. Further validation with an appropriately powered larger sample study and perhaps with automated tumor-segmentation technique with whole-brain volumetric data will ensure that the results are generalizable and robust. A well-designed prospective study with adequate power will allow the examination of multivariable models to distinguish tissues of origin on the basis of MRF distributional parameters. The role of MRF in differentiating the various potential tissues of origin in brain metastases also warrants further exploration. If additional studies validate and improve on our results, MRF may have a role in the imaging evaluation of brain tumors.
Conclusions
This study demonstrates the application of MR fingerprinting in the quantitative evaluation of glioblastomas, metastases, and lower grade gliomas, in which MRF-based relaxometry can identify quantitative differences between solid tumor regions of lower grade gliomas and metastases and between peritumoral regions of glioblastomas and lower grade gliomas. MRF offers the capability of rapidly generating quantitative relaxometry maps of brain tumors in a clinical setting. The utility of this technique needs to be further explored in larger sample studies.
Footnotes
Disclosures: Dan Ma—RELATED: Grant: National Institutes of Health.* Shivani Pahwa—RELATED: Grant: Siemens Healthcare, Comments: research support from Siemens.* Mark Schluchter—RELATED: Grant: National Institutes of Health.* Jeffrey Sunshine—RELATED: Grant: Siemens, Comments: sponsored research grant*; UNRELATED: Patents (Planned, Pending, or Issued): Siemens and Case Western Reserve University, Comments: MRI technical patents not covering this article.* Mark Griswold—RELATED: Grant: Siemens*; UNRELATED: Grants/Grants Pending: Siemens*; Patents (Planned, Pending, or Issued): Siemens, GE Healthcare, Bruker. Vikas Gulani—RELATED: Grant: National Institutes of Health, Siemens, Comments: Case Western Reserve University and University Hospitals receive research support from the National Institutes of Health and Siemens*; Support for Travel to Meetings for the Study or Other Purposes: National Institutes of Health, Siemens, UNRELATED: Grants/Grants Pending: National Institutes of Health, Comments: multiple additional National Institutes of Health grants*; Patents (Planned, Pending, or Issued): Siemens.* *Money paid to the institution.
Conflict of interest: Dan Ma, Vikas Gulani, Mark Griswold, and Jeffrey Sunshine receive research support from Seimens. Chaitra Badve, Dan Ma, Yun Jiang, Andrew Sloan, Jeffrey Sunshine, Mark Griswold, and Vikas Gulani have a pending patent application on this work.
This work was supported by National Institutes of Health 1R01BB017219 award (Principal Investigator: Dr. Mark Griswold) and 1R01EB016728 award (Principal Investigators: Drs. Mark Griswold and Vikas Gulani).
Paper previously presented at: Annual Meeting of the American Society of Neuroradiology and the Foundation of the ASNR Symposium, May 17–22, 2014; Montreal, Quebec, Canada; Annual Meeting of the Radiological Society of North America, November 30–December 5, 2014; Chicago, Illinois.
Indicates open access to non-subscribers at www.ajnr.org
References
- Received July 14, 2016.
- Accepted after revision October 11, 2016.
- © 2017 by American Journal of Neuroradiology


Jump to section
Related Articles
Cited By...
- Tailored Magnetic Resonance Fingerprinting
- Automated design of pulse sequences for magnetic resonance fingerprinting using physics-inspired optimization
- Intraoperative MR and Synthetic Imaging
- Normal Values of Magnetic Relaxation Parameters of Spine Components with the Synthetic MRI Sequence
- Radiomics in Brain Tumor: Image Assessment, Quantitative Feature Descriptors, and Machine-Learning Approaches