
Abstract
BACKGROUND AND PURPOSE: Vascular proliferation is a major criterion for grading gliomas on the basis of histology. Relative cerebral blood volume can provide pathophysiologic information about glioma grading. Vessel size imaging, in some animals, can be used to estimate the microvascular caliber of a glioma, but its clinical use remains unclear. Herein, we aimed to compare the predictive power of relative cerebral blood volume and vessel size imaging in glioma grading, with grading based on histology.
MATERIALS AND METHODS: Seventy patients with glioma participated in the study; 30 patients underwent MR perfusion imaging with a spin-echo sequence and vessel size imaging with a gradient-echo and spin-echo sequence successively at 24-hour intervals before surgery. We analyzed the vessel size imaging values and relative cerebral blood volume of differently graded gliomas. The microvessel parameters were histologically evaluated and compared with those on MR imaging. The cutoff values of vessel size imaging and relative cerebral blood volume obtained from receiver operating characteristic curve analyses were used to predict glioma grading in another 40 patients.
RESULTS: Vessel size imaging values and relative cerebral blood volume were both increased in high-grade gliomas compared with low-grade gliomas (P < .01). Moreover, vessel size imaging values had higher specificity and sensitivity in differentiating high-grade from low-grade gliomas compared with relative cerebral blood volume. In addition, a significant correlation was observed between vessel size imaging values and microvessel diameters (r > 0.8, P < .05) and between relative cerebral blood volume and microvessel area (r = 0.6579, P < .05). Most important, the use of vessel size imaging cutoff values to predict glioma grading was more accurate (100%) than use of relative cerebral blood volume (85%) values.
CONCLUSIONS: Vessel size imaging can provide more accurate information on glioma grading and may serve as an effective biomarker for the prognosis of patients with gliomas.
ABBREVIATIONS:
- HGG
- high-grade glioma
- LGG
- low-grade glioma
- max
- maximum
- MVA
- microvessel area
- MVD
- microvessel density
- rCBV
- relative cerebral blood volume
- SE
- spin-echo
- VSI
- vessel size imaging
Gliomas with different grades have different clinical behaviors that determine treatment planning and patient prognosis in clinical practice.1,2 Biopsy or examination of tumor tissues from surgical resection specimens is the only method available to establish the final diagnosis of tumor grading in cases of malignancy; however, this procedure is invasive.3 With regard to gliomas, tumor heterogeneity limits the ability of biopsies to accurately grade glioma tumors.
Functional MR imaging can provide quantitative or semiquantitative hemodynamic parameters, thereby allowing preoperative evaluation of the status of tumor angiogenesis, an important index in evaluating the grade of tumors and patient prognosis.4 CBV maps, derived from MR imaging during the application of first-pass bolus-tracking analysis, provide complementary information in the diagnosis of tumor grade and the extent of malignancy. Several authors have found that maximal relative cerebral blood volume (rCBV) correlates with glioma grading.5⇓–7 However, studies have shown that there were no significant differences in rCBV values between grade II and III gliomas8 or between grade III and IV gliomas.9 Moreover, a growing body of research has demonstrated the limited predictive power of rCBV to grade oligodendrogliomas, which tend to have high rCBVs regardless of glioma grade. Furthermore, oligodendrogliomas exhibit greater microvascular proliferation than astrocytomas8,10⇓–12; thus, rCBV may not be an ideal diagnostic tool for oligodendroglioma.8,13,14 Therefore, it is essential to explore an effective index for glioma grading that is independent of blood volume.
Vessel size imaging (VSI), which is obtained from the ratio of gradient-echo and spin-echo (SE) relaxation rate changes (▵R2*/▵R2) induced by intravascular superparamagnetic contrast agents, provides information on the average vessel size under certain conditions, such as the concentration of contrast agent, the main magnetic field, and TE.15 Recently, an increasing number of articles have reported that VSI can reflect the microvascular structures of tumors in animal models and strongly correlates with brain tumor grade.16,17 For example, Kiselev et al18 reported that VSI increased the information value on brain histopathology obtained during dynamic perfusion measurements and that the mean vessel size correlated with the tumor type. Lemasson et al indicated that VSI in MR imaging estimates was closest to histology and provided complementary information on characterizing angiogenesis beyond fractioned blood volume in the rat brain tumor model.4 Although several studies have indicated that VSI had a high accuracy rate for the diagnosis of the degree of tumor malignancy in animal models, the predictive power of VSI in human gliomas remains largely unknown.16,18,19 To our knowledge, the comparison of VSI and rCBV in human glioma grading has not been addressed previously.
We designed this prospective study, in which the sensitivities and specificities of rCBV and VSI in distinguishing low-grade glioma (LGG) from high-grade glioma (HGG) were compared, and the final diagnosis of the grades of gliomas and the measurement of microvessel parameters were performed histologically on the basis of surgical resection specimens. The optimal cutoff values of rCBV and VSI were used to evaluate their diagnostic accuracy rates for predicting glioma grading.
Materials and Methods
Patients and Samples
We selected patients with suspected primary gliomas followed by undergoing prospective perfusion-weighted imaging between March 2013 and August 2014. Then, tumors were diagnosed and classified according to World Health Organization 2007 criteria as confirmed by surgery. Among the selected patients, at least 30 had undergone both SE-perfusion and VSI at 24- to 48-hour intervals; these patients were assigned to group 1, from which the optimal cutoff value of VSI and rCBV to distinguish HGG from LGG would be generated, respectively. Once the optimal cutoff values were obtained, we needed to evaluate their diagnostic accuracy rates in the grading of gliomas. Thus, we designed protocols for the enrollment of, at minimum, 40 patients with suspected primary gliomas, followed by those who underwent SE-perfusion (20 patients), assigned to group 2, or VSI (20 patients), assigned to group 3 (On-line Table 1). In our next step, we used the optimal cutoff values of rCBV and VSI to predict the glioma grading of patients in groups 2 and 3, prospectively. Finally, diagnostic accuracy was calculated by comparing calculated values with pathologic results.
The inclusion criteria were the following: 1) MR imaging examination before the histologic examination; 2) no therapy before the MR imaging examination; 3) gliomas confirmed histologically; and 4) patients in group 1, whose clinical symptoms occurred in lesser degrees, able to undergo both SE perfusion and VSI and agreeing to undergo perfusion twice. The exclusion criteria were the following: 1) patients older than 80 years of age; 2) gliomas with grade I and histologic results showing no gliomas or rare gliomas; 3) in group 1, patients not having enough time (>24 hours) to have both SE perfusion and VSI before undergoing their operation; 4) contraindications to MR imaging; and 5) patients having false teeth, which would result in poor image quality. The study was approved by the local ethics committee at our institution, and all patients completed a written consent form.
MR Imaging
A 3T scanner (Magnetom Verio; Siemens, Erlangen, Germany) was used to acquire conventional MR imaging and DWI (details shown in the On-line Appendix) and spin-echo echo-planar perfusion scans. VSI was performed by using a 1.5T imager (Sigma HDx; GE Healthcare, Milwaukee, Wisconsin). The location line for all axial MR imaging was the central intercommissural (anterior/posterior commissure) line as previously described13,20 or parallel to this line.
Dynamic susceptibility contrast-enhanced perfusion MR imaging was performed by using the SE-EPI technique during administration of Gd-DTPA (Magnevist; Bayer HealthCare Pharmaceuticals, Wayne, New Jersey). The imaging parameters were as follows: TR/TE, 1500/30 ms; flip angle, 90°; matrix size, 128 × 128; NEX, 1.0; FOV, 23 × 23 cm. We selected 20 sections for perfusion imaging, in accordance with the T2-weighted imaging; at each section, 60 images were obtained. After 8 acquisitions, a bolus of gadobutrol (0.2 mmol per kilogram of body weight) was injected at a rate of 3 mL/s, immediately followed by a 20-mL bolus of saline at the same rate.
MR imaging data for VSI were acquired followed by intravenous injection of Gd-DTPA by using a gradient-echo and spin-echo sequence, with the following acquisition parameters: TR, 1500 ms; TE (gradient echo), 30 ms; TE (SE), 100 ms; flip angle, 90°; matrix size, 64 × 64; NEX, 1; FOV, 24 × 24 cm. Seven sections were selected across the tumor, with 120 images obtained at each section. In addition, VSI was obtained during injection of a bolus of 0.2 mmol/kg body weight of gadopentetate dimeglumine contrast agent at a rate of 3.5 mL/s with a time delay of 18 seconds, followed by a 20-mL bolus of saline.
VSI Measurements
The VSI images were analyzed by using an Advantage Workstation (Version 4.9; GE Healthcare) equipped with a dedicated software package (VSI; GE Healthcare). Using wide-bound or whole-observed brain as the input function and the generation of contrast-enhancement time–signal intensity curves for the input function, we calculated ▵R2*/▵R2 according to the decay curve. On the basis of the known observation that ▵R2*/▵R2 is a function of vessel size,21 VSI can be computed from this ratio according to the equation4,19: VSI = 0.425(ADC/γ▵ × B0)1/2× (ΔR2*/ΔR2)3/2, where ADC is the diffusion coefficient, by using 0.8 μm2/ms as analog data18; γ is the gyromagnetic ratio, the gyromagnetic ratio of hydrogen proton being 42.58 MHz/T; Δγ is the change values in magnetization rate; and B0 is the stationary field, 1.5T. The software (VSI) generated color-coded VSI images, the threshold of which was adjusted to 0–80 μm or 0–120 μm.
The preoperative and postoperative MR images were compared to outline the extent of surgery to increase the consistency between the regions of MR imaging and pathology measurements. A hand-drawn ROI of constant size (56 mm2) corresponding to the greatest visualized regions of perfusion was achieved by repeatedly moving the region in adjacent parts at least 5 times until the highest value was determined. We obtained approximately 10 values from at least 3 regions of the different cross-sectional images, while avoiding the vessels and necrotic tissue, recording the mean and maximal (max) values of all data as the VSImean and VSImax values for each patient. Measurements were performed by 2 neuroradiologists (H.-Y.K. and J.-Q.F, with 7 and 6 years of experience, respectively). Each observer, who was blinded to the histopathologic diagnosis, conducted each measurement twice and independently.
rCBV Measurements
The original SE images were processed with a commercial software package (SyngoMMWP VE36A; Siemens) and were used to generate color-coded CBV maps.3,22,23 The enhanced T1-weighted images were used as a guide for the location of the tumors to avoid the large vessels and necrotic tissue. The highest CBV values were obtained, and the rCBVmax normalization to the contralateral unaffected white matter CBV value was based on previously published methods.1,23,24 Measurements were performed by 2 neuroradiologists (H.-Y.K. and J.-Q.F). Each ROI was independently checked for accuracy by another observer, and any changes were made by joint agreement. The size of the ROIs was kept constant (radius = 2.6 mm). All analyses were performed without knowledge of tissue analyses.
Immunohistology Analysis
Each paraffin block from the 30 patients of group 1 was processed into a 4-μm-thick section, with 2–6 paraffin sections produced per patient. To measure the diameter of microvessels, microvessel area (MVA), and microvessel density (MVD) for grades II, III, or IV gliomas, we performed a histologic evaluation by immunohistochemistry for the CD34 antigen, which identified vascular endothelial cells as previously described.3,25 The reagent PV-6000-G Polymer Detection System for Immuno-Histologic Staining was bought from Beijing Zhong Shan-Golden Bridge Biologic Technology Company (Beijing, China). All tissue sections were digitized by using a fluorescence microscope (BX41; Olympus, Rungis, France) and the CellSens Standard software (http://www.scientific-computing.com/press-releases/product_details.php?product_id=809).
We examined entire sections at ×40 magnification, covering an area of 1.308 × 1.757 mm/field, to identify “hot spot” regions of microvascular diameter, MVA, and MVD, from which 5–10 hot spots were selected for imaging.26 By definition, the smallest countable blood vessels were used to estimate microvessel parameters.27 Microvascular diameter and MVA were measured at ×200 magnification, and MVD, at ×100 magnification.28 Quantitative microvascular analysis was performed by using Image-Pro Plus 5.0 software (http://www.mediacy.com/index.aspx?page=IPP), the microvessel diameter and MVA were determined by using the feret (min) and area (polygon) function,3 but the vessels with thick walls and lumens >72 μm were excluded.27 To minimize bias in the correlation between MR imaging and the histologic estimates, we analyzed the average diameter of all microvessels, MVD, and total area of all hot spot regions of each tissue section, and we compared sections from each patient to identify the highest values. Two experienced neuropathologists (H.-L.X and S.-G.F., with >10 years of experience) were blinded to the MR imaging results and completed the histologic measurements.
Statistical Analysis
Statistical analyses were performed by using commercially available software (SPSS, Version 19.0; IBM, Armonk, New York) to compare the MR imaging and pathologic data of different grades of glioma from patient group 1. Due to part of the data not being well-represented by a normal distribution, the results have been expressed as mean ± SD or median ± quartile range. The Kruskal-Wallis H test was used to evaluate differences in the VSImean values, microvascular diameter, MVA, and MVD in patients with glioma of different grades, and the Nemenyi method of the multiple comparison was performed. Multiple comparisons between groups were corrected by using the Bonferroni method. The ANOVA and the Least Significant Difference test were used to analyze differences in VSImax and rCBVmax values in patients with glioma of different grades. P values < .05 were statistically significant. Pearson correlation analysis was used to evaluate the relationship among VSI values, rCBVmax values, microvascular diameter, MVA, and MVD. Receiver operating characteristic curves were used to assess the specificity and sensitivity of the VSImax, VSImean, and rCBVmax values in distinguishing LGG from HGG. Interrater reliability between the 2 independent VSI observers and the two measurements of interobserver was assessed by using an intraclass correlation coefficient.
Results
Patient Population
Overall, 70 of 117 patients participated in our study. Thirty patients (15 women and 15 men; median age, 42 years; age range, 18–79 years) met the inclusion criteria of group 1, in which there were 9 low-grade (3 diffuse astrocytomas, grade II; 5 oligodendrogliomas, grade II; 1 oligoastrocytoma, grade II) and 21 HGGs. Among the high-grade tumors, 8 were diagnosed as grade III (3 anaplastic oligodendrogliomas, 2 anaplastic oligoastrocytomas, 3 anaplastic astrocytomas), and 13, as grade IV. In addition, we enrolled 20 patients into groups 2 and 3, respectively (On-line Table 1).
Characteristics of VSI and rCBV in Gliomas with Different Grades
Based on the reference standard, there was excellent intraobserver and interobserver agreement for VSImean (intraclass correlation coefficient > 0.879) and VSImax (intraclass correlation coefficient > 0.809).1 The final step was a calculation of the mean values generated from the 4 measurements made by the 2 independent observers. The VSI color map of grade II gliomas is represented in blue-green, denoting low VSI values (VSImean and VSImax values, 42.96 ± 26.43 μm and 79.10 ± 29.17 μm, respectively); however, the CBV maps of the 2 cases of grade II oligodendrogliomas are represented in red (Fig 1). The VSI and CBV colors maps of grade III and IV gliomas were inhomogeneous and are represented in red, denoting high VSImean values (glioma grade III, 130.89 ± 54.74 μm, and glioblastoma, 154.72 ± 13.64 μm), VSImax values (glioma grade III, 187.44 ± 43.63 μm, and glioblastoma, 212.26 ± 19.69 μm), and rCBV (glioma grade III, 9.15 ± 5.11, and glioblastoma, 10.78 ± 3.66). Although the high perfusion region of CBV partially overlapped that of VSI, the highest perfusion region did not match entirely (Fig 2).

A 25-year-old woman with an oligodendroglioma (World Health Organization grade II). A, Axial T2-weighted MR imaging demonstrates a right frontal and temporal lobe lesion with mass effect, a small amount of edema, and signal-intensity heterogeneity. B, Contrast-enhanced T1-weighted imaging demonstrates mild enhancement. C, The VSI map shows homogeneous low VSI values and is represented in blue-green. D, CBV map demonstrates clearly elevated perfusion in the tumor parenchyma.

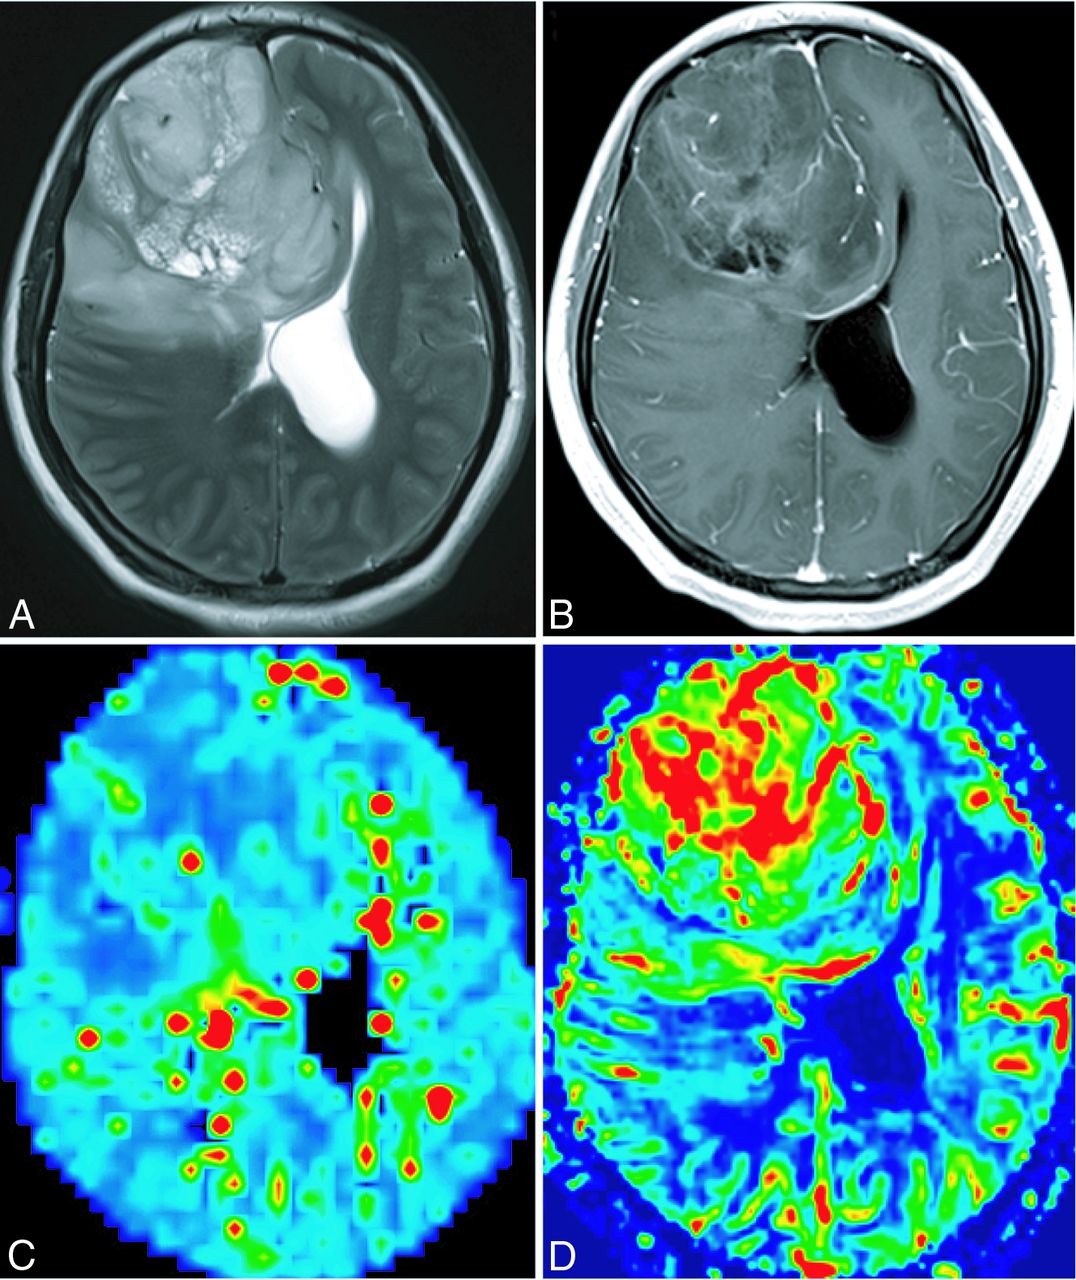
A 42-year-old woman with glioblastoma (World Health Organization grade IV). A, Axial T2-weighted MR imaging reveals a left temporal and occipital lobe lesion with mass effect, a moderate amount of edema, and homogeneous signal intensity. B, Contrast-enhanced T1-weighted imaging reveals marked enhancement. C, VSI map shows high VSI values. D, CBV map reveals the elevated perfusion more extensively. The highest perfusion region of CBV does not match entirely that of VSI.
Role of VSI and rCBV in Grading Gliomas and Receiver Operating Characteristic Analysis
We found that the VSImean and VSImax values and rCBV of grade III or IV gliomas were significantly higher than those of grade II gliomas (P < .01), whereas no significant differences were found in rCBV and the VSImean and VSImax values between gliomas with grades III and IV (On-line Fig 1A–C). To further explore the role of VSI values and rCBV in distinguishing LGG (grade II) from HGG (grade III and IV), we analyzed the sensitivity and specificity of the VSImean and VSImax values and rCBV by using receiver operating characteristic analysis. At the optimal cutoff VSImean values of 99.93 μm with the value of sensitivity + specificity-1 considered maximal, the sensitivity and specificity were both 100%. When the VSImax values were at the optimal cutoff of 138.3 μm, the sensitivity and specificity were 95.24% and 100%, and the AUC value was 0.9947 (On-line Fig 1D, -E). However, rCBV values at an optimal cutoff of 5.73, with just 85.71% sensitivity and 88.89% specificity, differentiated grade II gliomas from grade III or IV gliomas (On-line Fig 1F).
Histopathologic Characteristics
From the 30 subjects we enrolled, we collected a total of 75 paraffin blocks, which were used for both histopathologic diagnosis and microvascular quantification. The results revealed that the microvascular diameters and MVA of grade II gliomas were smaller (9.74 ± 6.17 μm and 3365.00 ± 3287.34 μm2) than those of grade III gliomas (23.93 ± 9.90 μm and 18,236.00 ± 7543.25 μm2) and grade IV gliomas (40.48 ± 18.30 μm and 18,196.00 ± 7534.50 μm2). The microvessel diameter and MVA of grade III and IV gliomas were significantly higher than those in grade II gliomas (P < .01). The MVD values of grade IV gliomas were significantly higher than those of grade II gliomas (P < .01); however, no significant differences were observed between grade II and III gliomas or grade III and IV gliomas (On-line Fig 2). Furthermore, the microvascular diameters of several grade II oligodendrogliomas were generally smaller than those of diffuse astrocytomas. However, the MVD and MVA of grade II oligodendrogliomas were larger than those of astrocytomas (data not shown).
Correlation between MR Imaging and Microvessel Parameters in Gliomas
Correlations between MVA and VSImean values, MVA and VSImax values, MVA and rCBV, microvessel diameter and VSImean values, microvessel diameter and VSImax values, and microvessel diameter and rCBV were all statistically significant (P < .01). Comparing MR imaging and microvessel parameters, we observed the strongest correlation between VSImax values and microvascular diameter (r = 0.831), followed by VSImean values and microvascular diameter (r = 0.824). Moreover, no clear correlation could be identified between rCBV and MVD or between MVD and VSI values (On-line Fig 3).
VSI and rCBV Values as Predictive Factors for Glioma Grading
The results revealed that the VSImean values in 14 patients were higher than the cutoff value (99.93 μm), whereas those in 6 patients were lower. The rCBV values in 13 patients were higher than the cutoff value (5.73), whereas those in 7 patients were lower. Compared with diagnosis by histology (On-line Table 1), as expected, the prediction of VSI for glioma grade had a 100% accuracy, whereas the accuracy of rCBV was 85%, in which 2 low-grade oligodendrogliomas had rCBV values higher than the cutoff value and 1 anaplastic astrocytoma was lower than the cutoff value (Fig 3).
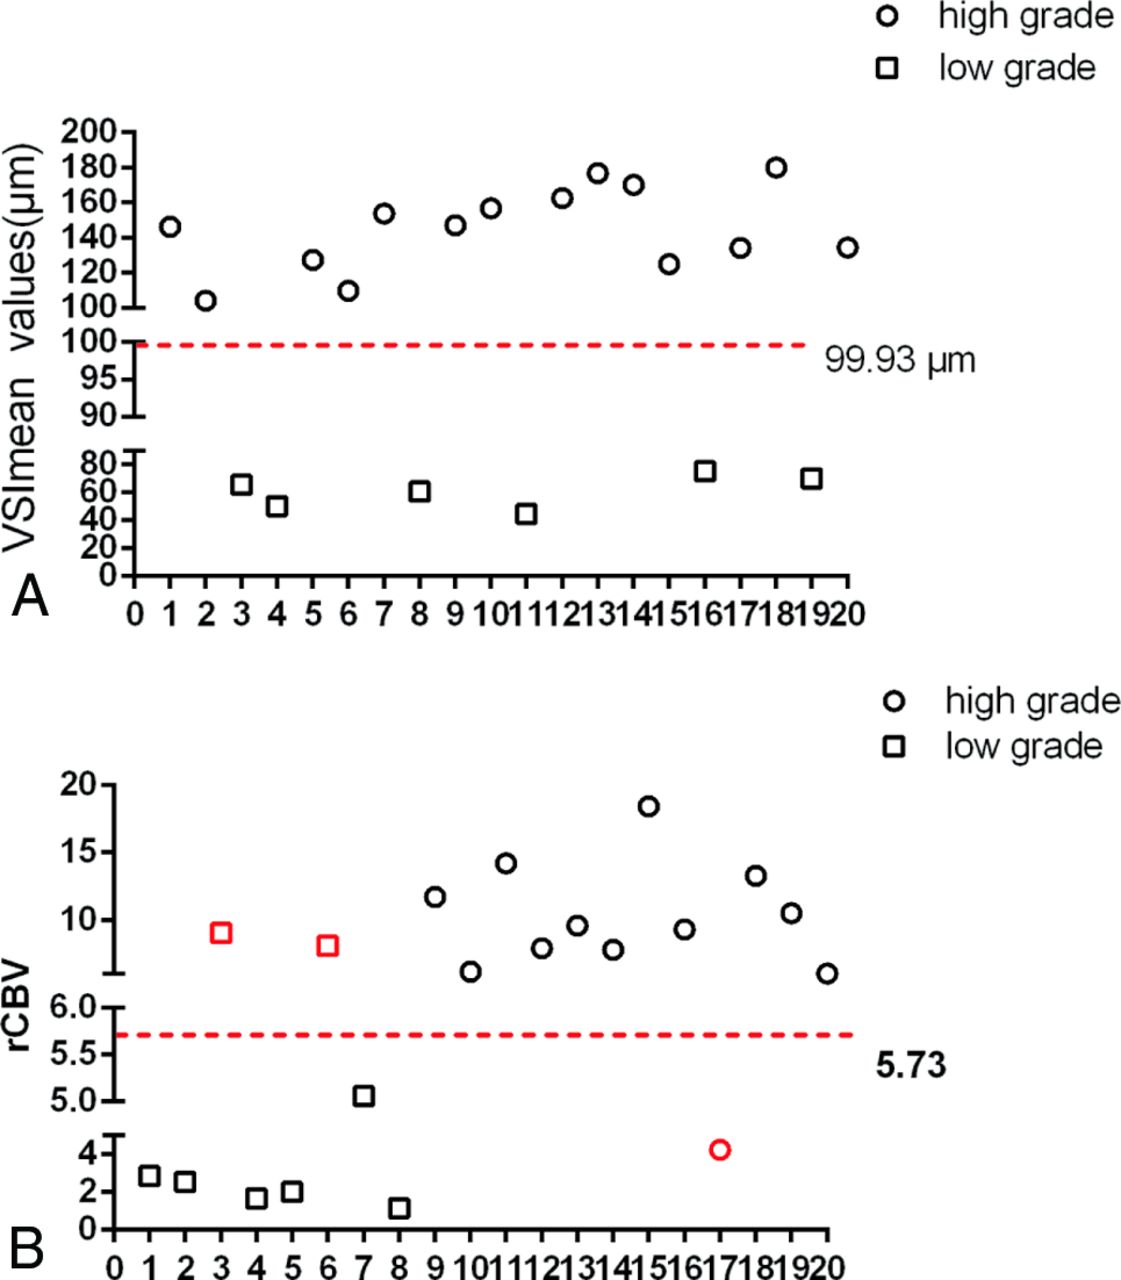
VSI and rCBV values in predicting the grade of gliomas. A, The VSImean values show no overlap between HGG and LGG and provide 100% accuracy in predicting the glioma grade. B, The glioma grade could not be exactly identified on the basis of the cutoff values of rCBV. Black indicates the cases correctly identified, and red denotes the cases incorrectly identified.
Discussion
In this study, we evaluated the sensitivities and specificities of rCBV and VSI in distinguishing LGGs from HGGs, and we obtained the optimal cutoff values of rCBV and VSI for glioma grading. We found that VSI had a higher accuracy rate in predicting glioma grading compared with rCBV. In addition, we measured microvascular diameter, MVD, and MVA by using CD34 to stain vascular endothelial cells. We found that microvascular diameters and MVA were strongly correlated with the glioma grade compared with MVD.
Histopathologically, endothelial proliferation is an important factor in determining the grades of gliomas.28 In recent years, several studies have indicated that tumor grades were strongly correlated with microvessel caliber and MVA, but MVD revealed a poor association with tumor grades.25 Consistent with this evidence, our results confirm that microvascular diameters and MVA could differentiate LGGs from HGGs, but MVD only distinguished grade II from grade IV gliomas. These findings suggest that microvessel structure has better efficacy in the grading of gliomas. Furthermore, the comparisons among rCBV, VSI, and histologic results were performed together in the same patients, and the results showed that VSI had better efficacy in reflecting the histologic features of glioma microvessels.
Although an increasing number of articles have shown that rCBV has a high accuracy rate in predicting glioma grades,3,29 oligodendrogliomas were shown to have preferentially high rCBV values regardless of glioma grade.6 In our study, we misdiagnosed 2 cases of low-grade oligodendrogliomas by using the rCBV cutoff value, suggesting that rCBV has limitations in the grading of gliomas. Most interesting, we found that the VSImean cutoff value had 100% accuracy in differentiating LGG and HGG, suggesting that VSI can be used to predict the oligodendroglioma grade. In addition, we found that grade II oligodendrogliomas had shorter microvessel diameters and higher MVD compared with diffuse astrocytomas, possibly resulting in high rCBV arising from oligodendrogliomas.
VSI was considered to noninvasively describe the pathologic changes of vessels in quantitative terms.17 In recent years, for VSI investigation, a large number of studies mainly focused on animal models. For example, Troprès et al17 found that VSI positively correlated with the pathologic diagnosis, a Spearman coefficient of 0.74. Lemasson et al reported that MR imaging and histologic estimates of VSI correlated well and may be used to characterize angiogenesis in vivo beyond CBV, as determined in 27 rats with intracranial gliomas.4 Recently, Emblem et al16 indicated that vessel architectural imaging had the potential to identify patients who might benefit from certain therapies. However, the application of VSI in human glioma grading remains unclear. In our study, we showed that the VSI values were positively correlated with the histologic results, with a correlation coefficient of >0.80, and VSI had a high accuracy rate in predicting glioma grades. In addition, we found that VSImean values had higher AUC, sensitivity, and specificity for glioma diagnosis than VSImax values; this outcome may have been the result of the following 2 points: 1) VSImean values better reflect the status of whole tumors; and 2) the signal-to-noise ratio of VSI is poor, resulting in a higher rate of errors in the measurement of VSImax values.
Our study had limitations. First, the number of the glioma samples, especially grade II and III gliomas, was modest. Second, robust VSI estimates should be obtained from patients at 3T or higher magnetic fields by using the DSC approach.30 Third, we used the “hot-spot” method, which cannot ensure the consistency between MR imaging regions and pathology measurements. Fourth, the time and space resolution of VSI was not as good as that of CBV; the signal-to-noise ratio of VSI images required enhancing to demonstrate regions of scattered perfusion in the cerebral tissue or lateral cerebral ventricles. Fifth, the lack of a unified approach to performing VSI measurement may result in unstable VSI cutoff values. In future studies, we will search for more objective and effective methods for VSI measurement.
Conclusions
In this study, we compared VSI, rCBV, and histologic results in grading gliomas and showed that VSI has greater accuracy at predicting glioma grading than rCBV, suggesting that VSI may serve as an effective tool for the diagnosis of patients with gliomas and for guiding the clinical therapeutic strategy.
Acknowledgments
We thank He Wang, Jing Ning, and Hui Lin for their technical assistance, and San-Gao Fang for the contribution to pathology measurement in this study.
Footnotes
Disclosures: Hou-Yi Kang, Jin-Hua Chen, Yong Tan, Tian Xie, Wei-Guo Zhang—RELATED: Grant: Natural Science Foundation of China (No. 81271626) and Chongqing (No. cstc2012jjB10028), and the Scientific Foundation of Institute of Surgery Research, Daping Hospital, Third Military Medical University (NO. 2014YLC03).* Xiao Chen—RELATED: Grant: National Natural Science Foundation of China (grant No. 81271626).* *Money paid to the institution.
This study was supported by grants from Natural Science Foundation of China (No. 81271626), Natural Science Foundation Project of Chongqing (cstc2012jjB10028), and the Scientific Foundation of the Institute of Surgery Research, Daping Hospital, Third Military Medical University (No. 2014YLC03).
Indicates open access to non-subscribers at www.ajnr.org
References
- Received March 17, 2015.
- Accepted after revision May 14, 2015.
- © 2016 by American Journal of Neuroradiology


Jump to section
Related Articles
Cited By...
- No citing articles found.