
Abstract
BACKGROUND AND PURPOSE: Patients with agenesis of the corpus callosum (AgCC) exhibit cognitive and behavioral impairments that are not replicated by surgical transection of the callosum, suggesting that other anatomic changes may contribute to the observed clinical findings. The purpose of this study was to determine whether the ventral cingulum bundle (VCB) is affected in patients with AgCC by using diffusion tensor imaging (DTI) and volumetry.
MATERIALS AND METHODS: Twelve participants with AgCC (8 males and 4 females; mean age, 30 ± 20) and 12 control subjects matched for age and sex (mean age, 37 ± 19) underwent MR imaging and DTI at 3T. 3D fiber tracking of the VCB was generated from DTI and the average fractional anisotropy (FA) was computed for the tracked fibers. Additionally, the volume, cross-sectional area, and length of the VCB were measured by manually drawn regions of interest on thin-section coronal T1-weighted images. The Student t test was used to compare these results.
RESULTS: Compared with controls, subjects with AgCC demonstrated significantly reduced FA in the right VCB (P = .0098) and reduced volume and cross-sectional areas of both the left and right VCB (P < .001 for all metrics). The length of the VCB was also significantly reduced in the complete AgCC subgroup compared with controls (P = .030 in the right and P = .046 in the left, respectively).
CONCLUSIONS: Patients with AgCC have abnormal microstructure and reduced volume of the VCB, suggesting that abnormalities in intrahemispheric white matter tracts may be an important contributor to the clinical syndrome in patients with AgCC.
Corpus callosal dysgenesis is a neurodevelopmental disorder affecting at least 1 in 4000 individuals.1–3 It is characterized by a partial or complete absence of the corpus callosum, collectively referred to as agenesis of the corpus callosum (AgCC). It is accompanied by a wide spectrum of neuropsychological deficits from subtle cognitive and behavioral symptoms to severe disabilities, including autism, mental retardation, epilepsy, and cerebral palsy.4,5 Among the less impaired individuals with AgCC, a common thread of clinical deficits fitting within the autistic spectrum is found.6 In contrast, these deficits are not observed in patients with commissurotomy, those whose corpus callosum was surgically severed.4,7,8 Additionally, patients with AgCC generally have better, though limited, interhemispheric integration than patients with commissurotomy based on diverse visual and tactile examinations.9 An interpretation of these differences is that absence of the corpus callosum is not the sole cause of the neurocognitive disturbances in individuals with AgCC and that callosal dysgenesis is simply the most anatomically visible manifestation of a more widespread white matter developmental disorder. Moreover, prior evaluation of the brains of patients with AgCC has shown frequent enlargement of portions of the lateral ventricles (colpocephaly), including the temporal horns.10 These findings suggest that intrahemispheric white matter tracts, including those in the medial temporal lobes, may also be affected in AgCC.
MR diffusion tensor imaging (DTI) is a noninvasive technique that can identify many microarchitectural characteristics of local brain tissue by evaluating bulk diffusion of water in 3D. Diffusion tensor−derived parameters such as fractional anisotropy (FA) can thus identify and characterize white matter bundles; in addition, these parameters may be used to depict pathologic changes in these white matter tracts.11 Altered white matter microstructure has been described in several conditions by using DTI and fiber tracking.12–14
The cingulum is an association fasciculus of the limbic lobe. The fibers of the dorsal cingulum curve around the lateral ventricles from the septal area below the genu of the corpus callosum through the cingulate gyrus above the body of the corpus callosum, and then the fibers of the ventral cingulum course inferolateral to run within the parahippocampal gyrus in the inferomedial temporal lobe.10 The cingulum provides substantial white matter connections within the corticolimbic neural system that subserves emotional regulation.12 Several previous studies have reported DTI and fiber tracking in patients with AgCC15–20; however, the study authors did not perform quantitative DTI and volumetric measurements of the ventral cingulum. In this article, we present these prospectively acquired DTI and volumetric data in patients with AgCC. On the basis of the neuropsychological symptoms both reported and observed in our AgCC cohort (E.H. Sherr, unpublished data) and of the prior studies that report enlargement of the temporal horns of the lateral ventricle into the parahippocampal gyrus,21,22 we undertook a study to investigate systematically the ventral cingulum bundle (VCB), to test whether it was abnormal in size or microstructure in our cohort of patients with AgCC. Our hypothesis was that the VCB would have reduced volume and FA in patients with AgCC compared with healthy controls.
Materials and Methods
Participants
Written informed consent was obtained from all participants under study protocols approved by the institutional review board at our medical center.
As part of an ongoing study on the imaging and genetic characteristics of developmental anomalies of the corpus callosum, 12 subjects with partial or complete AgCC were prospectively enrolled, along with 12 healthy controls matched by age, sex, and handedness (Table 1). No statistically significant difference in mean age was found between the subjects with AgCC and the controls (Student t test, P = .28). Participants’ handedness was determined from the Edinburgh inventory, whereas their intelligence quotients (IQs) were measured by using the Wechsler Abbreviated Scale of Intelligence or the Wechsler Adult Intelligence Scale. We excluded subjects with IQs <70 (due to their inability to provide informed consent and their inability to cooperate fully with the lengthy MR imaging examination) and those with fully formed but thin callosa (these were considered hypoplastic rather than dysgenetic or absent). No subjects with AgCC had epilepsy or were on medication.
Demographic data for control and AgCC cohorts and the 2 subgroups of the AgCC cohort: subjects with complete callosal agenesis (complete AgCC) and those with AgCC unaccompanied by cortical malformations (isolated AgCC)
MR Imaging
All MR imaging was performed on a 3T Excite scanner (GE Healthcare, Waukesha, Wis) by using an 8-channel Excite head phased array radio-frequency head coil.
Whole-brain 3T DTI was performed with a multisection 2D single-shot spin-echo echo-planar sequence (TE, 63 ms; TR, 7000 ms; NEX, 1), by using interleaved 1.8-mm axial sections with no gap, in-plane resolution of 1.8 × 1.8 mm with a 128 × 128 matrix, FOV of 230 mm, array spatial sensitivity encoding technique parallel imaging with a reduction factor of 2, and 55 diffusion-encoding directions at b = 1000 s/mm2. An additional image set was acquired without diffusion weighting (b = 0 s/mm2).
In addition to DTI acquisition, high-resolution 3D structural T1-weighted imaging (3D-T1WI) of the brain was performed with an axial 3D inversion recovery fast-spoiled gradient-recalled echo sequence (TE, 1.5 ms; TR, 6.3 ms; TI, 400 ms; flip angle, 15°; FOV, 230 mm; one hundred fifty-six 1.0-mm contiguous partitions at a 256 × 256 matrix). 3D-T1WI of all subjects was interpreted by 2 neuroradiologists certified by the American Board of Radiology, and the presence of any other brain anomalies was noted. Patients were included in a group only after the neuroradiologists agreed about the findings. The total acquisition time was 13 minutes.
DTI Data Postprocessing
Data were analyzed by using DTIStudio Version 2.4 software (http://1bam.med.jhmi.edu/index.htm), as described elsewhere.23 The 6 independent elements of the diffusion tensor, the 3 eigenvectors, associated eigenvalues, and FA were calculated. Fiber orientation was then encoded on color maps, with the color of each voxel indicating the direction of its primary eigenvector (red, left-right; green, anteroposterior; blue, superior-inferior) and the brightness of each voxel representing the FA.24
Fiber tracking was performed with the Fiber-Assignment by Continuous Tracking algorithm in DTIStudio, by using the brute-force method, in which tracks were seeded from all voxels in the brain with an FA value >0.3. Fibers were tracked while voxel FA values exceeded 0.2 and turning angles between the primary eigenvectors of neighboring voxels were <50°. Similar tracking parameters have been used in several recent DTI fiber tractography studies.25,26
Fiber tracking of the VCB was performed by placing 2 regions of interest in the anterior and posterior parts of the VCB, by using color-coded FA maps. Acquired axial sections and reconstructed midsagittal sections of the color-coded map were used to localize reconstructed coronal sections. An anterior region of interest was drawn on the coronal section immediately anterior to the pons (Fig 1A), and a posterior region of interest was placed on a coronal section aligned with the point of intersection of the external capsule and the posterior limb of the internal capsule (Fig 1B). Because the anatomic boundaries of the VCB were sometimes unclear on coronal sections of the color-coded map, relatively large regions of interest that included all green and blue voxels in the medial temporal lobe were placed as the anterior and posterior regions of interest. Fiber tracking of the VCB was then generated from the posterior region of interest to the anterior region of interest (Fig 1C). Spurious tracks were determined by visual inspection of the resulting tracts by all authors, including 2 board-certified neuroradiologists, and then were manually removed by use of exclusion regions of interest. The FA value of the VCB was calculated in DTIStudio from the 3D fiber tracking results.23,25 Fiber tracking protocols similar to ours have been shown to yield highly reproducible FA measurements.25

Reconstructed fiber tracts of VCB are overlaid on reconstructed coronal and midsagittal sections of the color map in a healthy control (A−C) and a patient with AgCC (D−F). A and D, An anterior region of interest (white line) is drawn on the coronal section immediately anterior to the pons. B and E, A posterior region of interest (white line) is placed on a coronal section aligned with the point of intersection of the external capsule and the posterior limb of the internal capsule. C and F, Fiber tracking of the VCB is then generated from a posterior region of interest to an anterior region of interest. Coronal sections in which an anterior region of interest and a posterior region of interest are manually drawn are shown in relation to each other on a sagittal section (white lines).
High-Resolution 3D-T1WI Data Postprocessing
The volume, average cross-sectional area, and length of the VCB were measured by manually drawing regions of interest on the reconstructed coronal images of 3D-T1WI (two hundred fifty-six 0.9-mm contiguous partitions at a 156 × 256 matrix) by using DTIStudio Version 2.4 software. To ensure reproducibility of measurements across subjects, we took care to ensure that axial sections were aligned parallel to the anterior/posterior commissure line.
The VCB was identified by use of a standard atlas,27 and the color map was generated from the DTI sequence. In the reconstructed coronal and sagittal sections of the color map, the VCB was identified as a green and blue area in the inferomedial aspect of the temporal lobe (Fig 2A). The anterior margin of the VCB was defined as the most anterior coronal section that contained the green-coded voxels of VCB in the reconstructed coronal images of the color map. The posterior margin of the VCB was defined as the most posterior coronal section that contained the gray matter of the hippocampal tail in the 3D-T1WI (Fig 2B). Regions of interest were manually drawn around the white matter of the VCB in all coronal sections between its anterior and posterior margins (Fig 2D). Because the VCBs were small in some patients with AgCC, we used fiber tracking as an additional measure to verify the anatomic references of the VCB. The margins of VCB in each coronal section were determined by visually identifying the anatomic boundaries and referring to the fiber tracts of the VCB on reconstructed coronal images of the color map (Fig 2C).
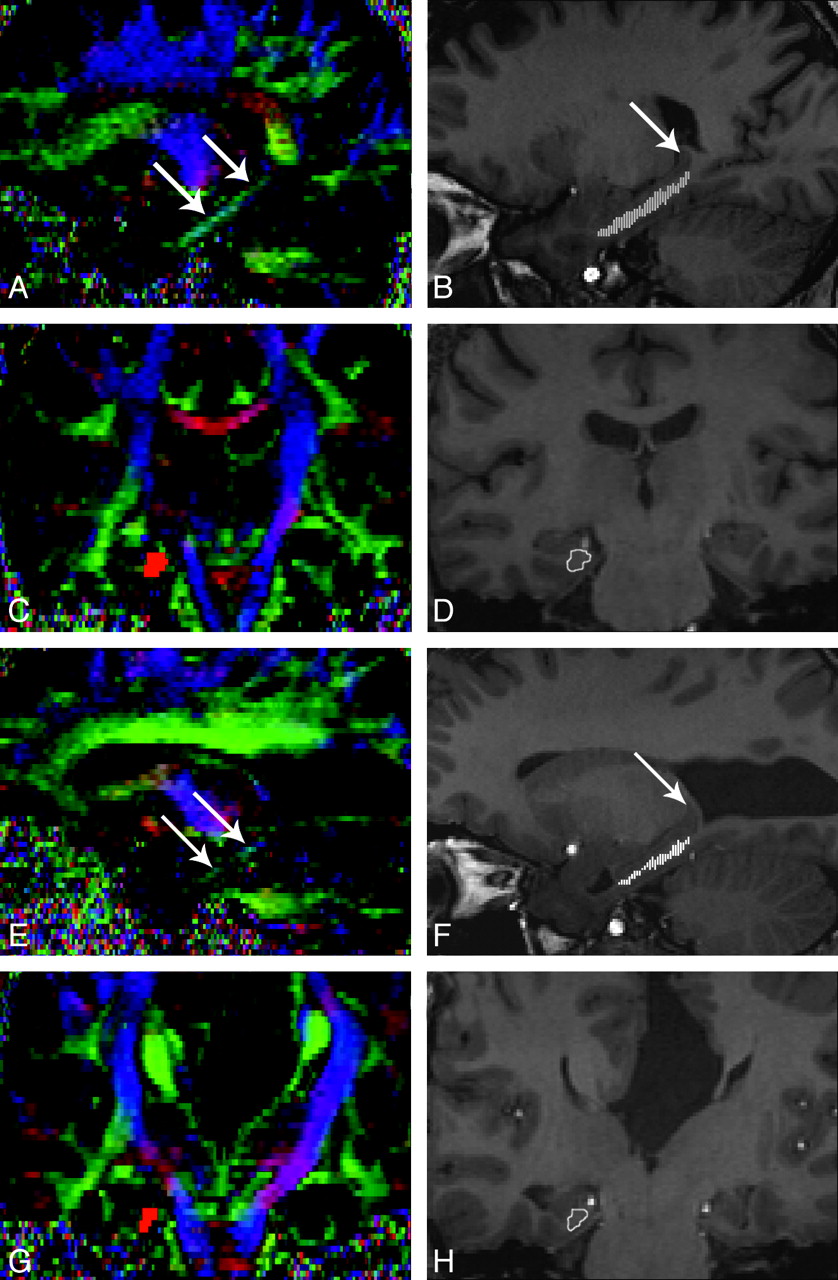
VCB on the color map and 3D-T1WI in a healthy control (A−D) and a patient with AgCC (E−H). A and E, In the reconstructed sagittal sections of color map, the VCB is identified as a green and blue area (arrows) in the inferomedial aspect of the temporal lobe. B and F, Multiple regions of interest are overlaid on a reconstructed sagittal section of 3D-T1WI (small white lines). Arrow indicates the gray matter of the hippocampal tail. C and G, Reconstructed fiber tracts of VCB are overlaid on a reconstructed coronal section of the color map (red area). D and H, A region of interest is drawn manually in each coronal section (white line) by visually identifying the anatomic boundaries and referring to the fiber tracts of VCB on reconstructed coronal sections of the color map.
The partitions of reconstructed coronal sections of the color map were two hundred fifty-six 0.9-mm contiguous partitions, the same as those of reconstructed coronal sections of the 3D-T1WI. The same locations of coronal sections on the color maps and the 3D-T1WI were found by visually referring to anatomic landmarks. Then, the number of pixels within each region of interest was counted, and the volume of the VCB was calculated by adding the pixel areas within the regions of interest and then multiplying the sum by the section thickness. The average cross-sectional area of the VCB was also calculated by averaging the areas within the regions of interest placed on all coronal sections. A measurement of the length of the VCB was calculated by adding the thickness of all coronal sections between the anterior and posterior margins of the VCB.
Statistical Analysis
Group comparisons between subjects with AgCC and healthy controls were made by using a Student t test (2-tailed unequal variances), with group differences considered significant at P < .05. Previous reports have shown significant age-related decreases of FA in cerebral white matter.28,29 Taking into account the effects of age, we calculated the partial correlation matrix between the measured FA and age by using bivariate correlation analysis (Pearson r) for both the subjects with AgCC and for the healthy controls.
Results
High-resolution 3D-T1WI showed that 8 subjects with AgCC had complete callosal agenesis, whereas the remaining 4 had partial agenesis. Of the 12 subjects with AgCC, 3 had associated malformations of cortical development. These consisted of gray matter heterotopia combined with left hemispheric polymicrogyria in all 3 cases. The heterotopia was confined to the left hemisphere in 1 patient and to the right hemisphere in 1 patient and was in both hemispheres in the third. The other 9 experimental subjects, without cortical malformations, are referred to as demonstrating “isolated AgCC.”
On the basis of these anatomic findings, we examined 2 subgroups within the AgCC cohort. One comprised the 8 subjects with complete agenesis, whereas the other consisted of the 9 subjects with isolated AgCC. Each AgCC subgroup was independently compared with a subgroup of the control subjects matched by age and sex.
We performed fiber tracking of the bilateral VCB and measured FA values in all patients with AgCC and controls (Fig 1D–F). We also measured the volume, cross-sectional area, and length of the bilateral VCB in all participants (Fig 2E−H). The average FA values, volume, cross-sectional area, and length of the VCB are summarized in Tables 2–5, with the statistically significant results indicated.
FA of the VCB in patients with AgCC and controls
FA values of subjects with AgCC were significantly lower than those in controls in the right VCB (Table 2). This difference was significant for the entire AgCC cohort (P = .0098) and for the complete AgCC and the isolated AgCC subgroups. However, no significant differences between patients with AgCC and controls were seen in the FA of the left VCB (P = .112). Additionally, no significant hemispheric asymmetry in the FA between the right and left VCB was seen in either controls or in subjects with AgCC (P = .85 and P = .55, respectively). No significant correlation with age of FA values of either the right or the left VCB was identified (P > .05) in either AgCC subgroups or healthy controls.
The volume (Table 3) and cross-sectional area (Table 4) of the entire AgCC cohort was significantly lower than those of the control group in both the right and left VCB. These differences were significant for the entire AgCC cohort and for the complete AgCC and the isolated AgCC subgroups (P < .001 for all comparisons).
Volume of the VCB in patients with AgCC and controls
Cross-sectional area of the VCB in patients with AgCC and controls
The length of both right and left VCBs in the complete AgCC subgroup was significantly less than that of controls (Table 5). However, no significant differences in the length of either right or left VCB was found between the entire AgCC group and controls or between the isolated AgCC subgroup and controls.
Length of the VCB in patients with AgCC and controls
In neither the control nor the AgCC cohort was there any significant hemispheric asymmetry in the volume, the cross-sectional area, or length of the VCB (P = .13 and P = .38 in the volume, P = .22 and P = .21 in the cross-sectional area, P = .70 and P = .89 in the length, respectively).
Discussion
The present study investigated the relationship of DTI metrics and volumetry of the VCB in patients with AgCC and controls. Our results show that patients with AgCC have significantly lower FA of the right VCB, and they substantiate previous anecdotal observations that patients with AgCC have a smaller cross-sectional area of the bilateral VCB compared with matched controls.22 In addition, the length of both the left and right VCBs in the complete AgCC subgroup was significantly less than that of controls. These results demonstrate both the disruption of the normal microstructural organization of the VCB and the diminished size of the tract. We do not believe that the lower FA and the diminished size of the tract are necessarily directly correlated because FA increases when the space between the axons in the tract is small, even if the tract size is diminished. Nonetheless, our findings certainly suggest that the VCB develops abnormally in patients with AgCC, indicating a relationship between the formation of the corpus callosum and that of the VCB. Such a relationship is not surprising when one considers that the hippocampus is a paramedian structure in the young fetus and that the cingulum seems to play an important role in the development of the corpus callosum. Indeed, pioneering axons from the cingulate cortex (ventral cingulum) are the first to cross the midline as part of the corpus callosum in mice.30,31 These pioneering axons are believed to act as guides across the midline with subsequent cortical commissural axons crossing through the process of fasciculation.32 Therefore, our finding is consistent with a primary disorder of axonal pathfinding within the cingulum being the primary event, with callosal axons unable to cross the midline as a result of abnormal cingulum development. Abnormal expression of guidance molecules on cell surfaces of midline structures such as the glial wedge and the indusium griseum may also contribute to the abnormal guidance.33
Patients with schizophrenia have been shown to have reduced FA in both the dorsal cingulum bundles34–36 and the VCB,37,38 and a number of recent studies have reported volume loss in the cortex of the parahippocampal gyrus.39,40 Abnormalities of the dorsal cingulum have also been reported in bipolar disorders.12 These observations support the proposal that AgCC and schizophrenia may both be disorders of cerebral connectivity,41 even though the clinical manifestations are quite distinct, and some of the symptoms of patients with AgCC may be the result of abnormal development of the cingulum. Most interesting, there are anecdotal reports of patients with schizophrenia and AgCC.42,43
To the best of our knowledge, no previous studies have investigated the volumetry of intrahemispheric white matter tracts in patients with AgCC. Although the present study was limited by a small sample size, it is distinguished by the high resolution of the studies at 3T and the quantitative nature of the results. The FA values of our subjects with AgCC were significantly lower than those in controls in the right VCB; however, no significant differences between patients with AgCC and controls were seen in the FA of the left VCB. The cause of this asymmetry is not clear. Even though many genes associated with brain malformations have been identified, the precise embryopathologic mechanisms are far from clear. Parrini et al44 have recently shown that identical mutations in the GPR56 gene cause frontal polymicrogyria in different areas of the frontal lobes, and they do not fully understand why. Genetic polymicrogyrias, such as those associated with 22q11.2 deletions,45 often have asymmetric involvement of the cerebral hemispheres, but it is not clear why that is the case. Similarly, we do not know why there is asymmetric involvement of the VCBs. It does not seem to be related to the presence of other malformations because the asymmetry was seen both in isolated ACC and in those with associated malformations. We hope that identification of this finding will help geneticists find the causative gene and that, ultimately, the mechanism that causes the malformation will be revealed.
Although our finding of reduced volume and cross-sectional area of the VCB was consistent among all AgCC subgroups considered, changes in the length of the VCB were found only in the group with complete AgCC. This finding suggests a possible direct linkage between the severity of callosal deficits and those of the VCB; again this is not surprising considering the embryologic relationships between the structures. Unfortunately, our study cohort was too small to test that hypothesis directly. DTI investigation in a larger cohort may reveal these and other more subtle changes to white matter microstructural organization in AgCC.
There are several limitations of this study. One is that our patient cohort was selected from a population with AgCC who are relatively high functioning and able to undergo MR imaging without sedation. However, young children or those severely affected individuals who would require scanning under sedation to acquire DTI data were generally not included in this aspect of our research study. Another limitation is poor resolution of axonal bundles that cross other pathways. Because DTI assumes a single fiber orientation in each voxel, crossing fibers are incompletely characterized. FA measurement might thus be affected by the presence of crossing fibers from aberrant white matter structures in subjects with AgCC or the absence of normal commissural crossing fibers. However, along the course of the VCB, significant fiber crossing would not be expected to occur. The other limitation is intravoxel partial volume averaging. However, high spatial resolution with 1.8-mm isotropic voxels was used in the present study to optimize evaluation of relatively small white matter tracts such as the VCB. To ensure high data reliability of the present DTI study, we used high magnetic field strength at 3T, a multichannel phased array head coil, a relatively short echo time of 63 ms, and high angular resolution with 55 diffusion-encoding directions. This technique allowed adequate signal intensity to noise to perform our evaluations of the VCB. Several recent reports also showed reduction of bias and increase of the precision of FA measurements by using high angular resolution.46,47
Conclusions
This study supports our hypothesis that AgCC is associated with microstructural alterations in the organization and reduction in overall tract volume of the VCB. This result is similar to the findings of DTI and volumetric studies of schizophrenia, raising the possibility that AgCC and schizophrenia may share some common mechanisms of white matter dysgenesis. By examining more extensively the relationship between the white matter microstructural organization and the clinical symptoms of AgCC, MR imaging may provide considerable insight into the understanding of these neurodevelopmental disorders.
Footnotes
This work was supported by grants from the National Institutes of Health (NIH) to E.H.S.; the March of Dimes and the University of California, San Francisco, Strategic Opportunities Support Center of the Clinical and Translational Sciences Institute; and a grant from the American Society of Pediatric Neuroradiology. This study was also made possible by grant UL RR024131-01 from the National Center for Research Resources (NCRR), a component of the NIH and NIH Roadmap for Medical Research.
References
- Received October 2, 2008.
- Accepted after revision January 9, 2009.
- Copyright © American Society of Neuroradiology
In this issue


Jump to section
Related Articles
Cited By...
- Pathogenic DDX3X mutations impair RNA metabolism and neurogenesis during fetal cortical development
- Underdevelopment of the Human Hippocampus in Callosal Agenesis: An In Vivo Fetal MRI Study
- Sonographic Development of the Pericallosal Vascularization in the First and Early Second Trimester of Pregnancy