
Abstract
BACKGROUND AND PURPOSE: We sought to derive regional cerebral blood flow using vessel flows from quantitative MR angiography (qMRA).
MATERIALS AND METHODS: Flow rates in the 15 major cerebral arteries were measured on retrospectively gated fast 2D phase-contrast MR angiography obtained in 83 healthy adult volunteers (age range, 24–74 years; mean, 42 years). The arterial network of the brain was partitioned into 12 different regions, in which flows were calculated from the measured flows of the 15 cerebral arteries.
RESULTS: The mean flows of the 15 arteries and the 12 regions were calculated. The mean total cranial flow and the mean total cerebral blood flow were 949 ± 158 mL/min and 695 ± 113 mL/min, respectively. The mean regional flows for the anterior and posterior circulation were 483 ± 87 mL/min and 212 ± 34 mL/min, respectively. The relative contributions of the flows in the 11 regions to their parent regions were obtained. The mean flows in the individual arteries and the regions with age were also calculated. The mean flows for the female group were significantly lower than those for the male group (P < .001) for the 2 common carotids and the cranial circulation and left/right extracranial circulation. However, the intracranial circulation was not different between sexes.
CONCLUSIONS: The 12 regions in the cerebral circulation were identified and formed into a partition tree, and the mean regional flow for each region was determined using vessel flows from qMRA.
Quantification of blood flow to the brain may be useful for distinguishing patients at risk for cerebral ischemia caused by hemodynamic compromise. Hemodynamic assessment by quantitative MR angiography (qMRA) has been used to identify patients at high risk for stroke and to guide treatment decisions.1,2 qMRA has been used to determine the total cerebral blood flow (CBF),3–5 the effect of age and sex on the total CBF,6 distribution of CBF in the circle of Willis,7 and cerebral autoregulation,8 as well as to evaluate various cerebrovascular disorders.9–16 The range of blood flow for a healthy individual vessel in the brain, however, can be quite diverse because of inherent vascular anatomy and/or anatomic variations in the circle of Willis.7 A decreased flow in an individual vessel may not necessarily be caused by vascular disease. An effective decision-making paradigm based on hemodynamic assessment requires an algorithm that accounts for both anatomic variations and assessment of flows in distal vessels (regional CBF).1 However, current methods for assessing regional CBF can be technically difficult, time consuming, and may subject the patient to ionizing radiation.10,11,17 The purpose of this present study was to determine the flows to specific brain areas, that is, regional cerebral flow using individual vessel flows obtained from qMRA.
Methods
qMRA
qMRA was performed on either a 1.5T or 3T MR imager (Excite; GE Healthcare, Milwaukee, Wis). The MR volume flow measurements were calculated from NOVA software (VasSol, Chicago, Ill) on a separate PC workstation. The protocol that uses a retrospectively gated fast 2D phase-contrast sequence has been described previously.1,18,19
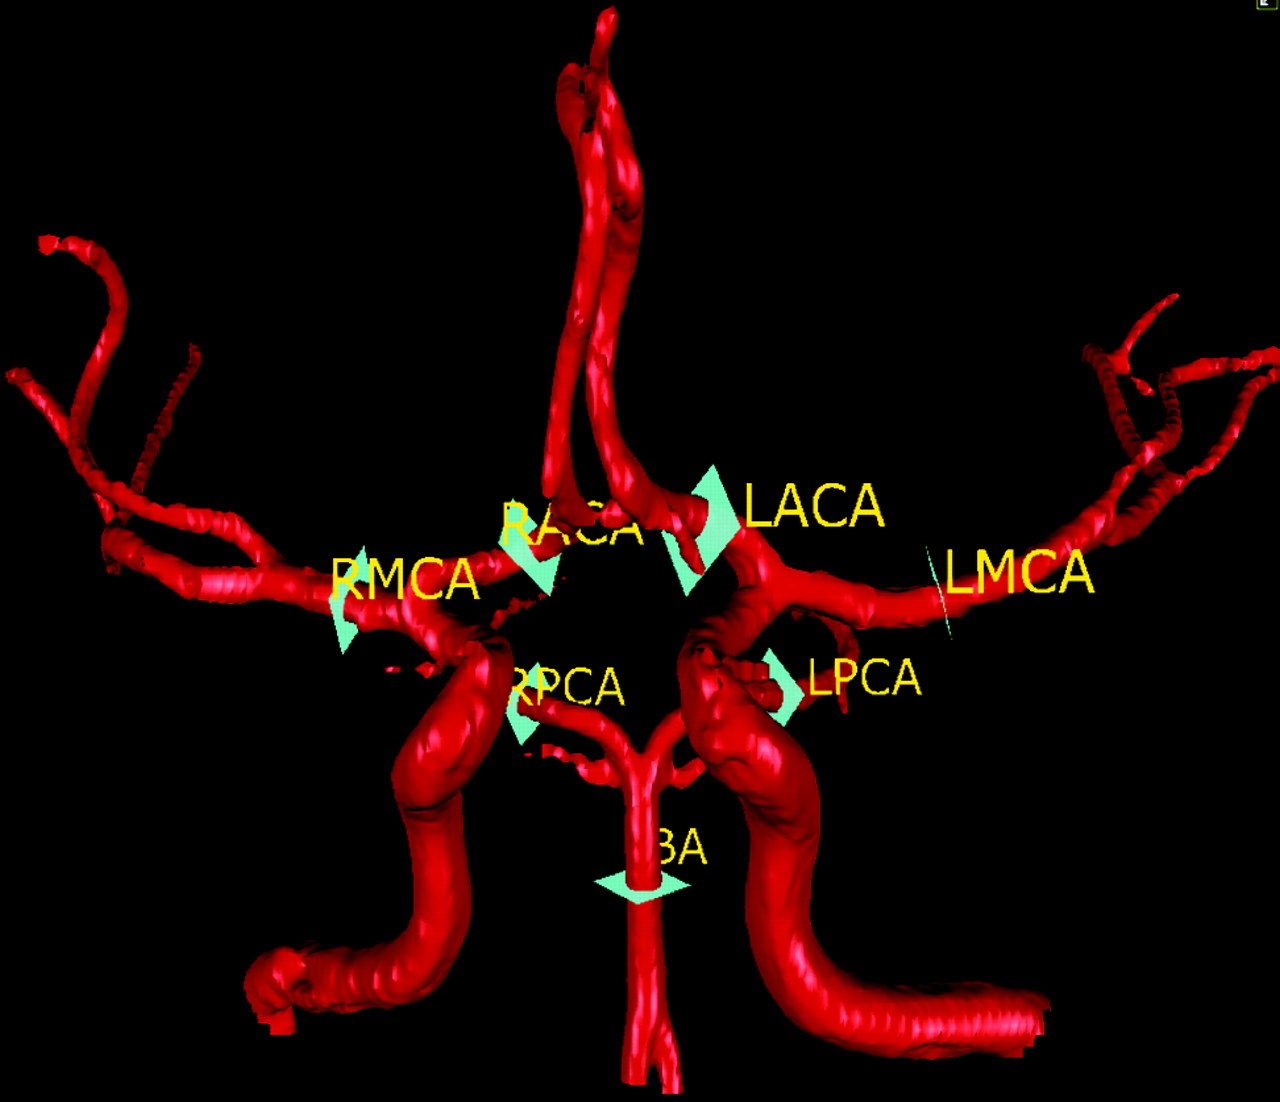
The protocol entails performing a standard axial 2D and 3D time-of-flight (TOF) MR angiography (MRA) of the cervical and cranial vasculature, similar to conventional neck and head MRA. The acquired TOF images were then transmitted to a workstation where rotating 3D surface-rendered vascular images (Figs 1 and 2) were reconstructed using a marching-cube algorithm.18 Optimal perpendicular scan plane determination was based on the scan line calculated by a line-fitting algorithm introduced by Zhao et al.18 The coordinates obtained specify the position of an oblique fast 2D phase-contrast sequence, which was then performed based on these coordinates, using a retrospectively gated 2D phase-contrast sequence with the following imaging parameters: TR, 10–15 ms; TE, 4–7 ms; flip angle, 15; number of excitations, 4; section thickness, 5 mm for neck vessels and 3 mm for intracranial vessels; FOV, 180 mm for neck vessels and 140 mm for intracranial vessels; and matrix, 256 × 128 for neck vessels and 256 × 192 for intracranial vessels. Velocity encoding was automatically adjusted with the NOVA software if necessary. The acquired phase-contrast images were transferred to the workstation for flow quantification. A region of interest was automatically placed on the phase-contrast images and was also displayed in the 3D surface-rendered image for vessel verification. The vessel borders over a cardiac cycle were automatically extracted and displayed on the color-coded and magnified region of interest image for vessel border verification. The velocities at all of the pixels inside the vessel border were then integrated to calculate the flow in milliliters per minute. The flows were averaged over a cardiac cycle to obtain the mean flow for each vessel. The total scan time necessary for the entire qMRA study was 30–45 minutes. This protocol has been used routinely for the evaluation of patients with cerebrovascular diseases.1,20

The 6 section planes showing where the flow measurements were made for the 6 neck vessels..

The 7 section planes showing where the flow measurements were made for the 7 head vessels..
The flow measurement accuracy using the protocol has been extensively tested with phantom blood flow simulators.19 For steady flow conditions, the average variation from actual measurements was only 4.1% ± 3.0%. For pulsatile flow conditions, the variation was only 4.5% ± 3.1%.19 The intrarater reliability has been investigated by repeated measurements in adult subjects. Coefficients of variation were within 5% for 9 vessels and 5%–10% for 3 vessels.21 Vessel measurement variation was also examined by performing 2 consecutive full 13-vessel scans, removing the subject from the scanner between scans.22 Mean coefficients of variation were less than 5% for 7 vessels and 5%–10% for 5 vessels.22 The interrater reliability was investigated by measuring flows from different users on 2 different vessels (11 different operators were used for the basilar artery; 9 different operators were used for the left middle cerebral artery). Mean coefficients of variation were less than 4% for both vessels (data on file at VasSol).
The measured vessels include 6 vessels in the neck, 7 vessels in the head, and the left and right posterior communicating artery (PcomA; LPcomA and RPcomA) if present. The 6 vessels in the neck include the left and the right common carotid arteries (LCCA and RCCA), the left and the right internal carotid arteries (LICA and RICA), and the left and the right vertebral arteries (LVA and RVA). Figure 1 depicts the locations of the neck vessel measurements. The 7 vessels in the head include the basilar artery, the M1 segment of the left and the right middle cerebral arteries, the A1 segment of the left and the right anterior cerebral arteries, and the P2 segment of the left and the right posterior cerebral arteries. Figure 2 depicts the locations of the intracranial vessel measurements. The measurements for both the flow rate and the flow direction for each vessel, as well as the vascular anatomy of both head and neck, were assessed on a PC workstation by a physician.
Partition Algorithm
Cranial circulation (CCr) is the circulation in cranial region (where “r” in CCr stands for region). CCr consists of the right extracranial circulation (RECr), the left extracranial circulation (LECr), and the intracranial circulation (ICr). ICr consists of the anterior circulation (ACr) and the posterior circulation (PCr). ACr consists of the right middle cerebral region (RMCr), the left middle cerebral region (LMCr), and the anterior cerebral region (ACAr). PCr consists of the right posterior cerebral region (RPCr), the left posterior cerebral region (LPCr), and the cerebellar-basilar region (CBr). The partitions of the CCr were formed into a partition tree (Fig 3). A parent region can have 1 or more than 1 subregion. CCr is the parent region for LECr, RECr, and ICr. ICr is the parent region for ACr and PCr. ACr is the parent region for LMCr, RMCr, and ACAr. PCr is the parent region for LPCr, RPCr, and CBr.

Partition tree of the cerebral circulation.
The flow to each of the 12 regions was calculated as follows. CCr flow was determined by summing the flows of the 4 inlet vessels to the brain, that is, LCCA, RCCA, LVA, and RVA. The ICr flow was determined by summing the flows of the 4 inlet vessels to ICr, that is, LICA, RICA, LVA, and RVA, which is the mean total CBF. LECr (or RECr) flow was determined by subtracting the LICA (or RICA) flow from the LCCA (or RCCA) flow. ACr flow was obtained as follows: summing the LICA and RICA flows, subtracting any fetal PCA or posterior directed PcomA flows. Alternatively, anterior directed PcomA flow would be added. PCr flow was obtained by subtracting ACr flow from ICr flow. The ACAr flow was calculated by summing the left and right anterior cerebral region flows (valid only for healthy volunteers, otherwise flow direction should be considered). The CBr flow was determined by subtracting the sum of LPCr and RPCr flow from the PCr flow.
Subjects and Data Analysis
Ninety-two healthy adult volunteers (age range, 21–74 years; mean age, 42 years; 43 men and 49 women) without history of cerebrovascular disease underwent qMRA of head and neck vessels. Subjects gave informed written consent before participating. The institutional review board of the University of Illinois at Chicago approved the study protocol.
Flows were expressed as mean ± SD. The differences in age between men and women were tested using a Student independent t test. Paired Student t test was used to determine the differences between flows for the left and right arteries (or regions). The effect of age on flows for individual vessels and regions was evaluated using linear regression analysis. In all of the tests, P < .05 was considered statistically significant. All of the analyses were performed with Analyze-it (1.71, Analyze-it Software, England).
Results
Of 92 subjects, 9 were excluded because of subject motion (n = 1), missed RACA measurement (n = 1), and missed PcomA measurements (LPcomA, RPcomA, or both PcomAs; n = 7). Eighty-three subjects (age range, 24–74 years; mean age, 42 years; 40 men and 43 women) had adequate QMRA studies and were included in the data analysis. Among the 83 subjects, 7 subjects had unilateral fetal PCAs (8%), 3 had bilateral fetal PCAs (4%), 1 had persistent trigeminal artery (1%), 1 had absent RACA (1%), 28 had no PcomAs (34%), 22 had both PcomAs (26%), and 33 had only 1 PcomA (40%). The flow directions in the PcomAs were posterior in all but 1 subject. Nine subjects had very short M1 segments (11%) where the flows of the 2 M2 branches were measured and summed to derive the flow of the M1 segment.
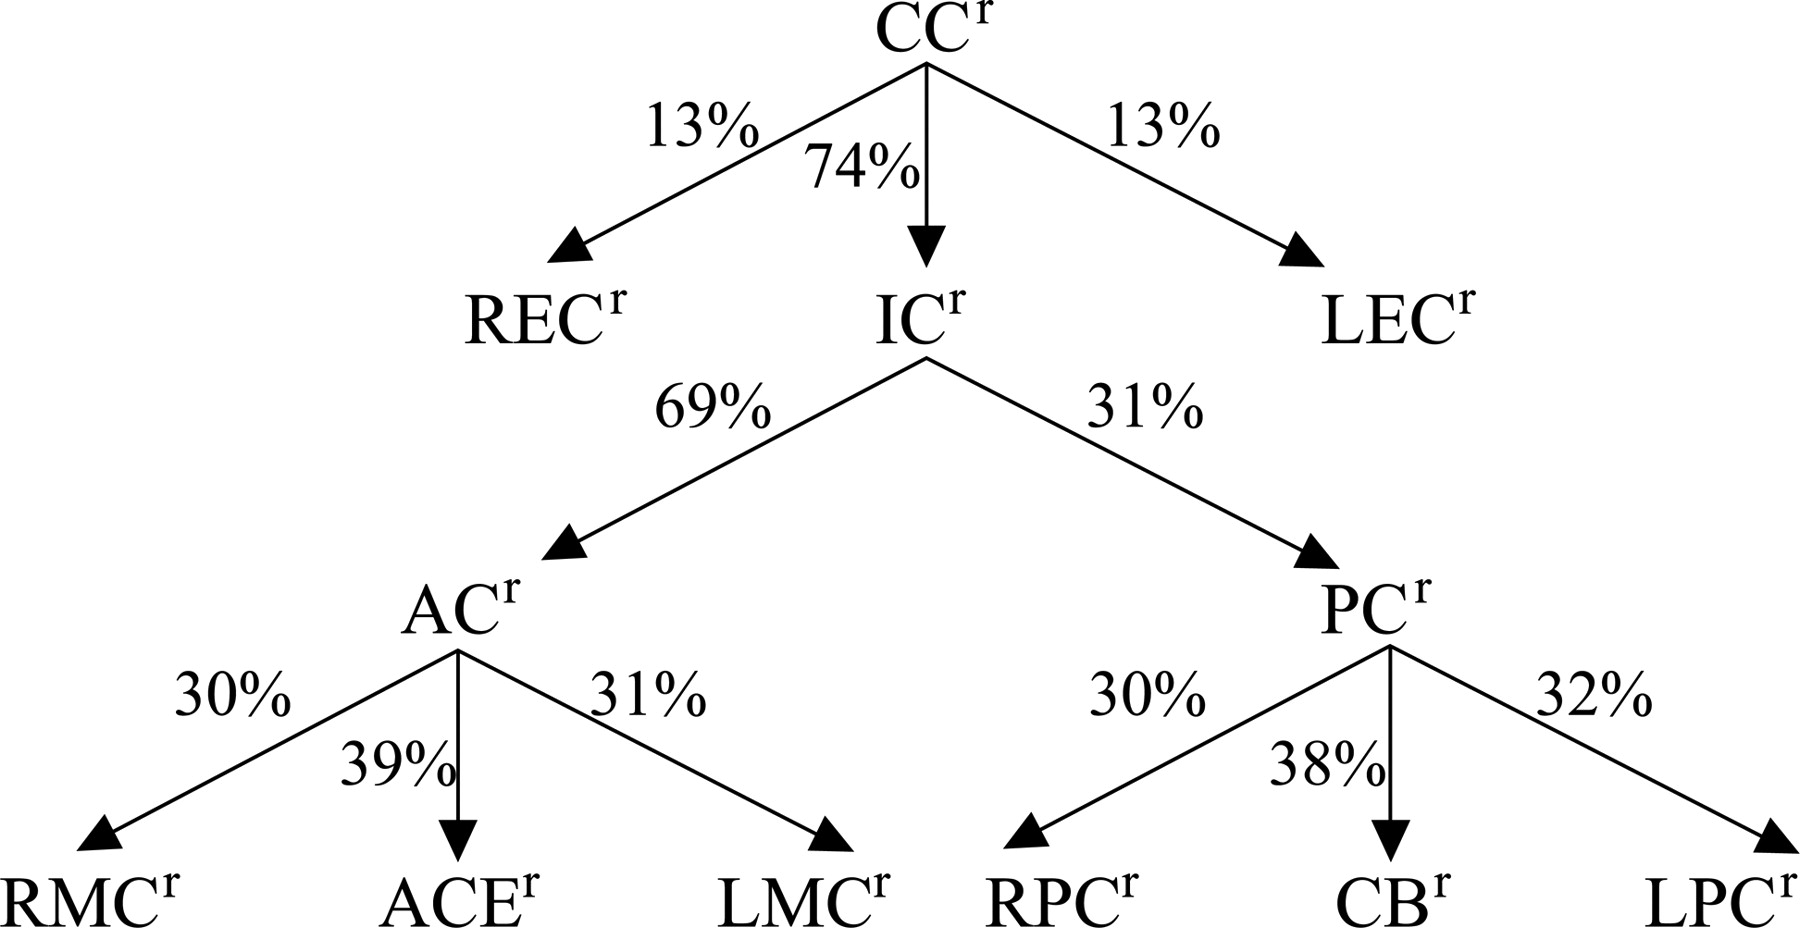
The mean flows of the 15 arteries and the 12 regions are shown in Tables 1 and 2, respectively. The mean flows were as follows: CCr, 949 ± 158 mL/min; ICr, 695 ± 113 mL/min; ACr, 483 ± 87 mL/min; and PCr, 212 ± 34 mL/min. The relative flow contribution in each of the 11 regions to their parent regions is shown in Fig 4. The relative contribution from the 3 subregions to CCr was 74% ± 9% for ICr, 13% ± 5% for LECr, and 13% ± 5% for RECr. The relative contribution to ICr from its 2 subregions was 69% ± 3% for ACr and 31% ± 3% for PCr. The relative contribution to ACr from its 3 subregions was 31% ± 4% for LMCr, 30% ± 3% for RMCr, and 39% ± 6% for ACAr. The relative contribution to PCr from its 3 subregions was 32% ± 5% for LPCr, 30% ± 5% for RPCr, and 38% ± 9% for CBr.

The relative contribution of flows in each of 11 regions to its parent region.
Flow rates in the fifteen arteries
Regional cerebral blood flows in the cerebral circulation
Table 3 shows the effect of age on the mean flows for individual arteries and regions. Overall, both total cranial flow (CCr) and total cerebral flow (ICr) declined with age (P < .02), from 1047 ± 178 mL/min (CCr) and 788 ± 102 mL/min (ICr) for the youngest group (age 24–30 years; n = 12) to 905 ± 129 mL/min (CCr) and 621 ± 71 mL/min (ICr) for the oldest group (age 61–74 years; n = 4).
Flows of either individual arteries or regions decreased with age
Table 4 shows the sex difference of the mean volume flows for individual arteries and regions. The mean flows for the female group were lower than the male group (P < .001) for the total CCr, the 2 common carotids (LCCA and RCCA), and the LECr and RECr. However, the ICr was not different between sexes.
Gender differences in flows of either individual arteries or regions
Discussion
In this study, we partitioned the cerebral arterial network into 12 different regions. We calculated the regional CBF using the measured flows of the 15 cerebral arteries as obtained by qMRA. Based on these measurements in subjects without history of cerebrovascular disease, the SDs of the relative contribution of the ACr and PCr to the ICr are small (3%). The SDs of the relative contribution of the LMCr and RMCr to the ACr are also small (4% and 3%, respectively). Unlike individual vessel flows that are subject to wide variability based on anatomic variations in the circle of Willis,7 these regional flows may provide a more reliable measure of hemodynamic status.
Many methods, including the nitrous oxide,23 133xenon (Xe)- single-photon emission CT (SPECT),9,17 Xe-CT,24 positron-emission tomography (PET)25,26 dynamic MR,25,27 and perfusion CT,24 have been used to measure the regional CBF. In most studies,9,17,23–27 CBF values were reported in terms of milliliters per 100 grams of brain tissue per minute, and in some studies CBFs were determined separately for white and gray matter. In a study of the effect of age on the total CBF using nongated 2D PC MRA,5 a factor of 10.81–12.14 was used in the correlation between the total CBF (milliliters per minute) from the 2D PC MRA and the total CBF (milliliters per minute 100 grams) from the nitrous oxide, 133Xe-SPECT, Xe-CT, and PET. Our findings for the total CBF, that is, total cerebral flow (ICr), were comparable with those total CBF values from either gated or nongated 2D PC MRA.3–5
A limitation of the present study was ophthalmic and middle meningeal artery flows were assumed to be negligible. Although this assumption may be reasonable for healthy volunteers, those volume flows could be significant in some patients with occlusive intracranial cerebrovascular disease and, therefore, must be taken into account in the calculation of the regional CBF. In addition, diseases like Moyamoya may be problematic to evaluate, because large vessels are typically replaced by multiple intracranial and extracranial collateral vessels that may not be amenable to flow measurement and would not be accounted for by the partitioning model. For the patient with an extracranial circulation-intracranial circulation bypass,28 the bypass flow must be measured and included in the regional flow calculation. Last, the number of subjects in each age group was small, especially in the oldest age group. This may limit our findings for the effect of age on both vessel flow and regional CBF.
In conclusion, regional CBF can be calculated using qMRA. The relative contribution of the subregions to the parent region, along with the regional flows, could provide useful information in the hemodynamic evaluation of patients with cerebrovascular disease.
Footnotes
This work was generously supported by the Falk Foundation.
References
- Received July 24, 2006.
- Accepted after revision January 6, 2007.
- Copyright © American Society of Neuroradiology
In this issue


Jump to section
Related Articles
Cited By...
- Cerebral blood flow pattern in patients with carotid artery stenosis with low trans-stenotic blood flow
- In Vitro Evaluation of Intra-Aneurysmal, Flow-Diverter-Induced Thrombus Formation: A Feasibility Study
- Combined Selective Cerebral Hypothermia and Mechanical Artery Recanalization in Acute Ischemic Stroke: In Vitro Study of Cooling Performance
- Preclinical Evaluation of the Thrombogenicity and Endothelialization of Bare Metal and Surface-Coated Neurovascular Stents
- Evaluating Intracranial Atherosclerosis Rather Than Intracranial Stenosis
- Quantification of speed-up and accuracy of multi-CPU computational flow dynamics simulations of hemodynamics in a posterior communicating artery aneurysm of complex geometry
- In Vivo Evaluation of Quantitative MR Angiography in a Canine Carotid Artery Stenosis Model
- Hemodynamics and Anatomy of Elastase-Induced Rabbit Aneurysm Models: Similarity to Human Cerebral Aneurysms?
- Detection of Intracranial In-Stent Restenosis Using Quantitative Magnetic Resonance Angiography
- The Utility of Quantitative Magnetic Resonance Angiography in the Assessment of Intracranial In-Stent Stenosis